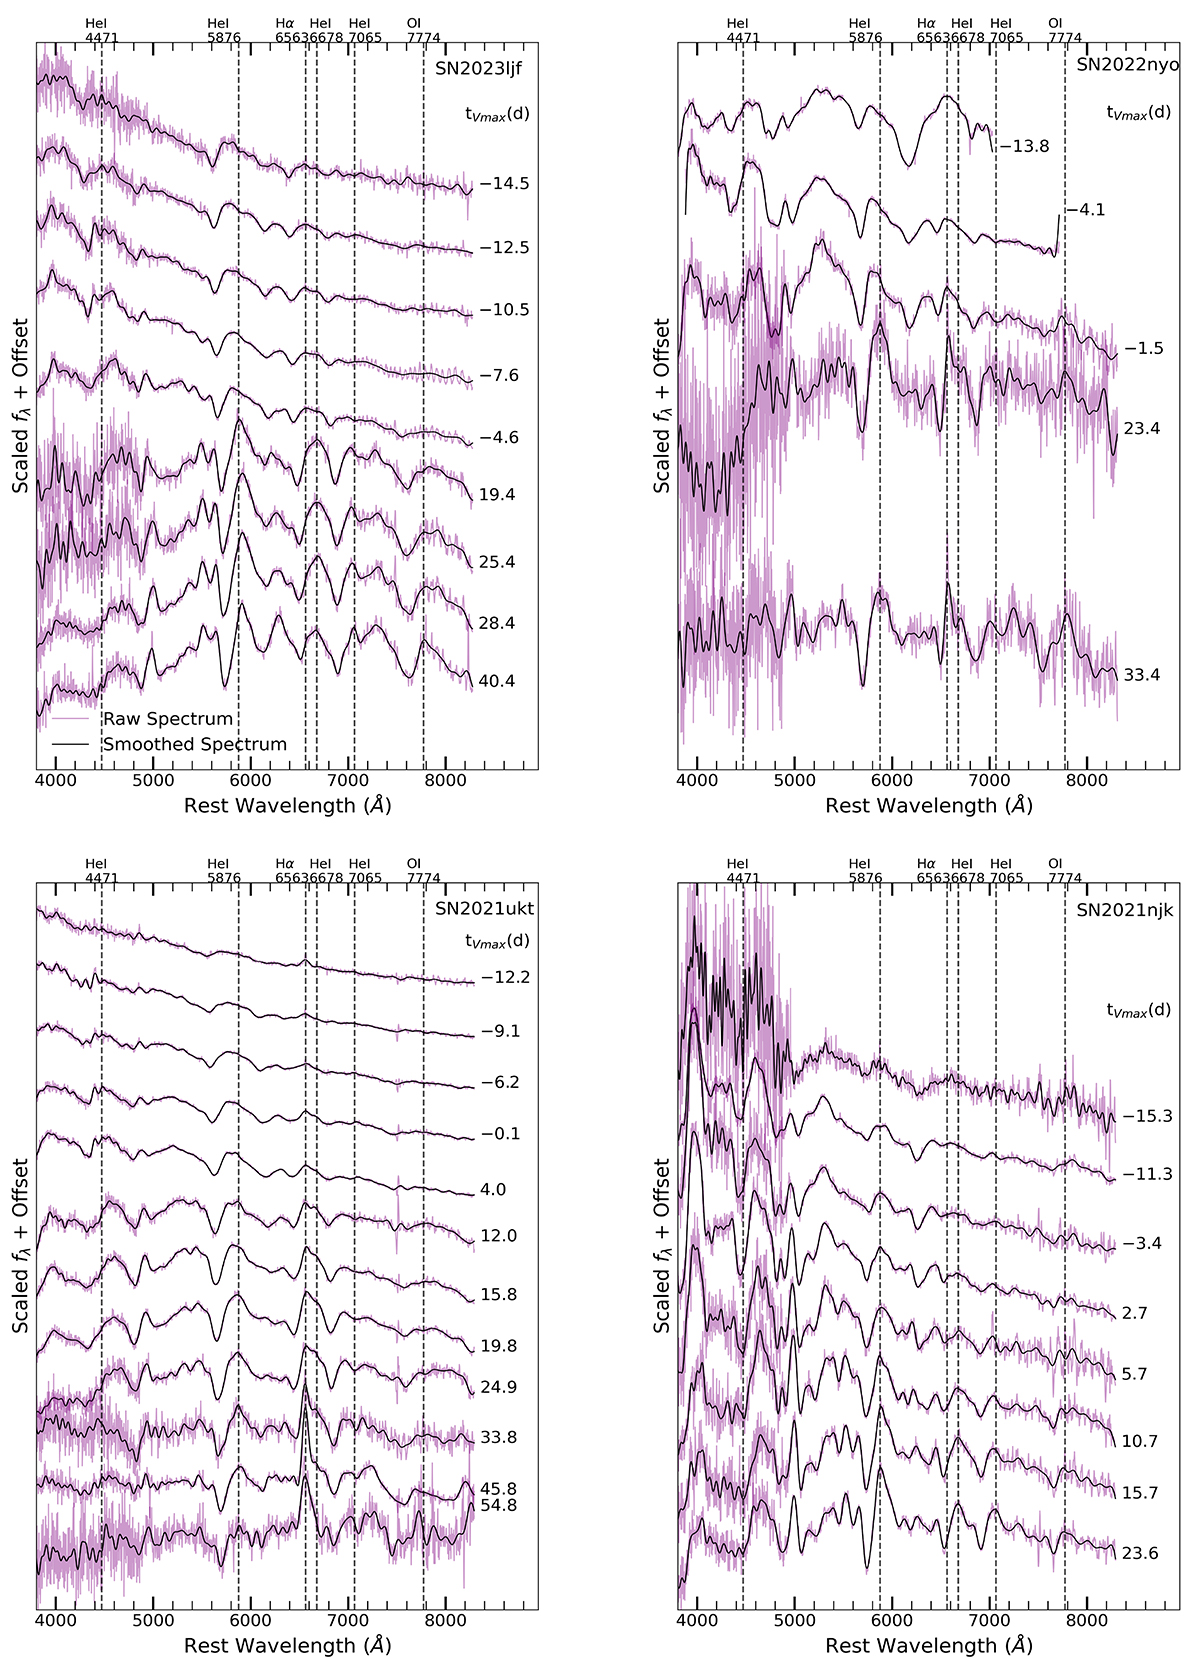
Fig. A.1.
Download original image
Spectral time series for all eight SNe Ib presented in this work. The flux fλ, measured in units of erg s−1 cm−2 Å−1, is normalized, and an offset is added to enhance the visualization of the temporal evolution of the spectra. The smoothed spectra (produced following the procedure described in Appendix B of Liu et al. 2016), shown as solid black lines, are highlighted in the foreground, while the reduced spectra before smoothing are in purple in the background. Dashed vertical lines mark the HeI 4471, HeI 5876, HeI 6678, HeI 7065, Hα 6563, and OI 7774 lines, and the phases are relative to the date of the V-band maximum (tVmax). We note that we manually removed galaxy emission lines from the spectra at tVmax = −13.8d and −4.1d of SN 2022nyo. All SNe were chosen to have at least three spectra before maximum light in V-band. Thus, the observed change in the SN types for almost half of our sample could be uncovered with our large number of pre-maximum and post-maximum spectra. See Figure 1 in the main text for an illustrative example.
Current usage metrics show cumulative count of Article Views (full-text article views including HTML views, PDF and ePub downloads, according to the available data) and Abstracts Views on Vision4Press platform.
Data correspond to usage on the plateform after 2015. The current usage metrics is available 48-96 hours after online publication and is updated daily on week days.
Initial download of the metrics may take a while.