Fig. 2
Download original image
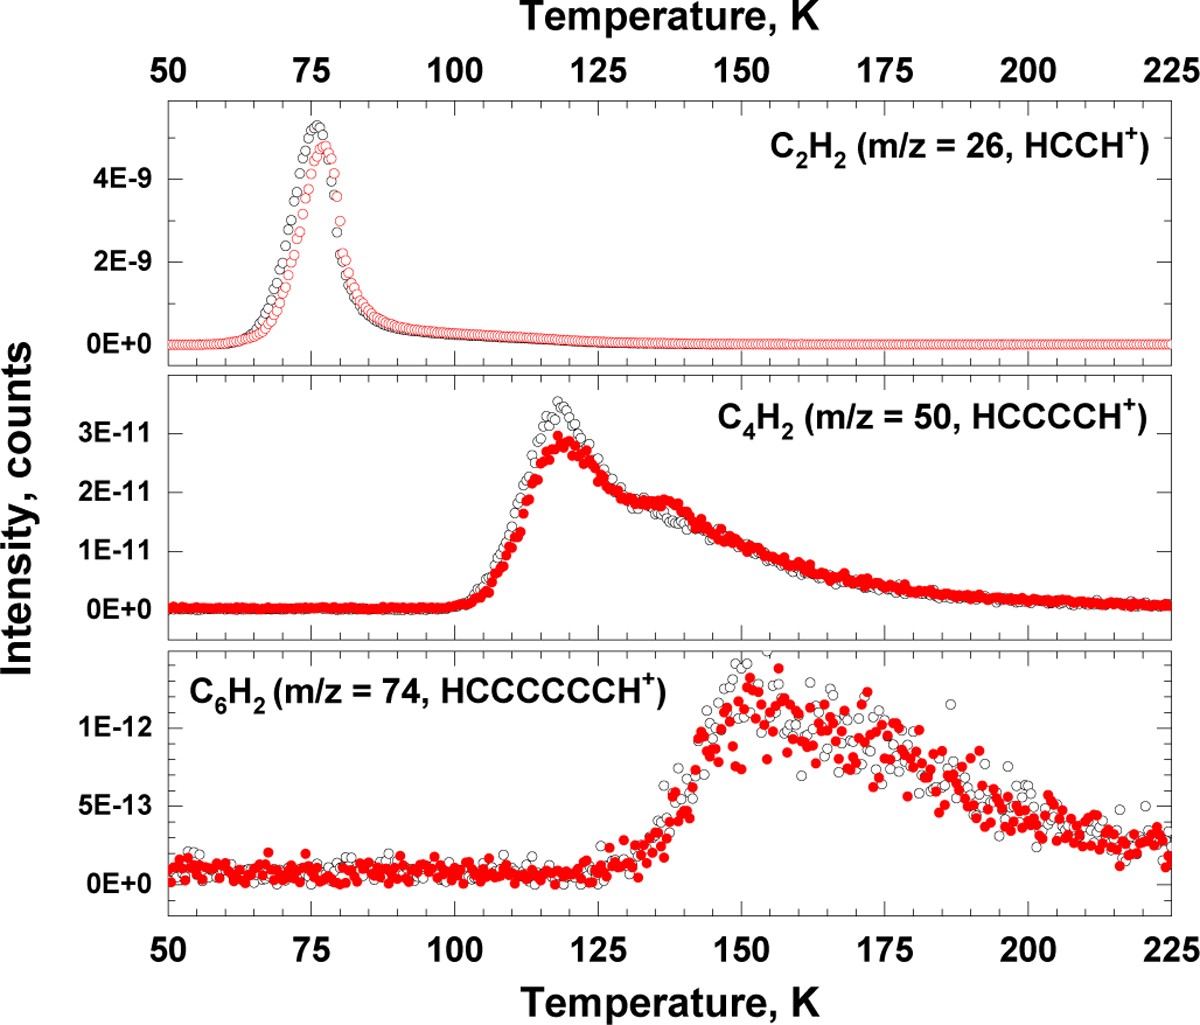
Direct comparison between the fragments of QMS-TPD spectra in the range from 50 to 225 K obtained after the UV-exposure of 10 ML thick pure HCCH ice at 10 K with >4.6 × 1016 cm−2 photons (black empty circles) and the subsequent exposure of this photoprocessed ice with 1.3 × 1017 cm−2 H atoms at 10 K (red filled circles). The results obtained upon subtraction of the initial mass spectrum from the mass spectrum obtained upon hydrogenation of the ice for each of the presented m/z values are presented in Appendix A.
Current usage metrics show cumulative count of Article Views (full-text article views including HTML views, PDF and ePub downloads, according to the available data) and Abstracts Views on Vision4Press platform.
Data correspond to usage on the plateform after 2015. The current usage metrics is available 48-96 hours after online publication and is updated daily on week days.
Initial download of the metrics may take a while.