Open Access
Fig. 5.
Download original image
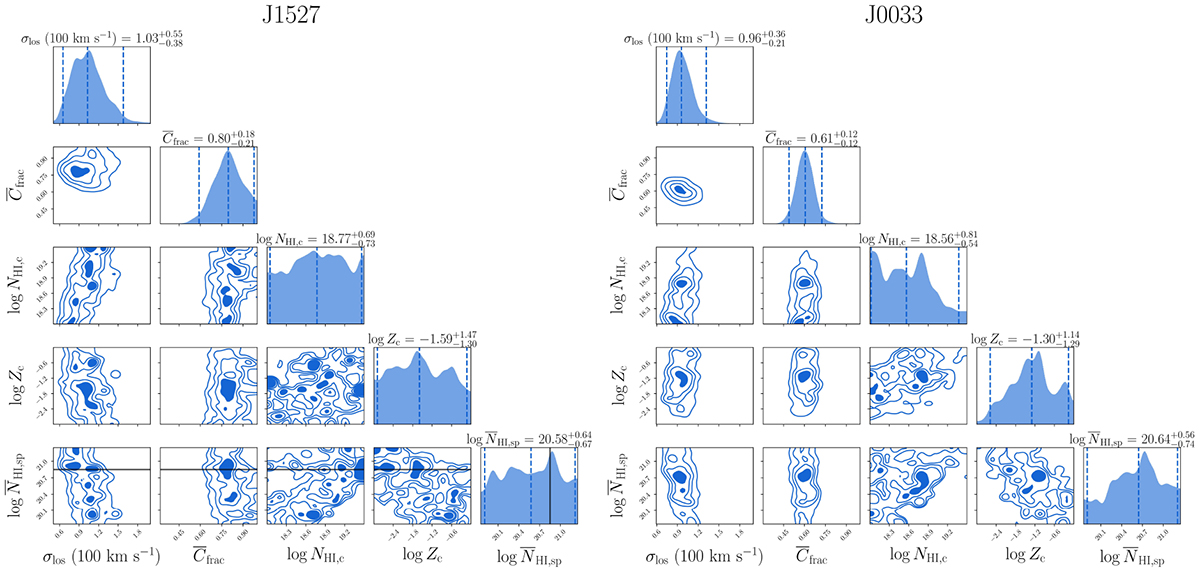
Posterior distributions resulting from the Bayesian analysis described in Sect. 4.2. The blue vertical dashed lines show the median and 2σ uncertainties of each distribution and the black line marks the HI column density estimate of Bordoloi et al. (2022), which is consistent with our predictions.
Current usage metrics show cumulative count of Article Views (full-text article views including HTML views, PDF and ePub downloads, according to the available data) and Abstracts Views on Vision4Press platform.
Data correspond to usage on the plateform after 2015. The current usage metrics is available 48-96 hours after online publication and is updated daily on week days.
Initial download of the metrics may take a while.