Open Access
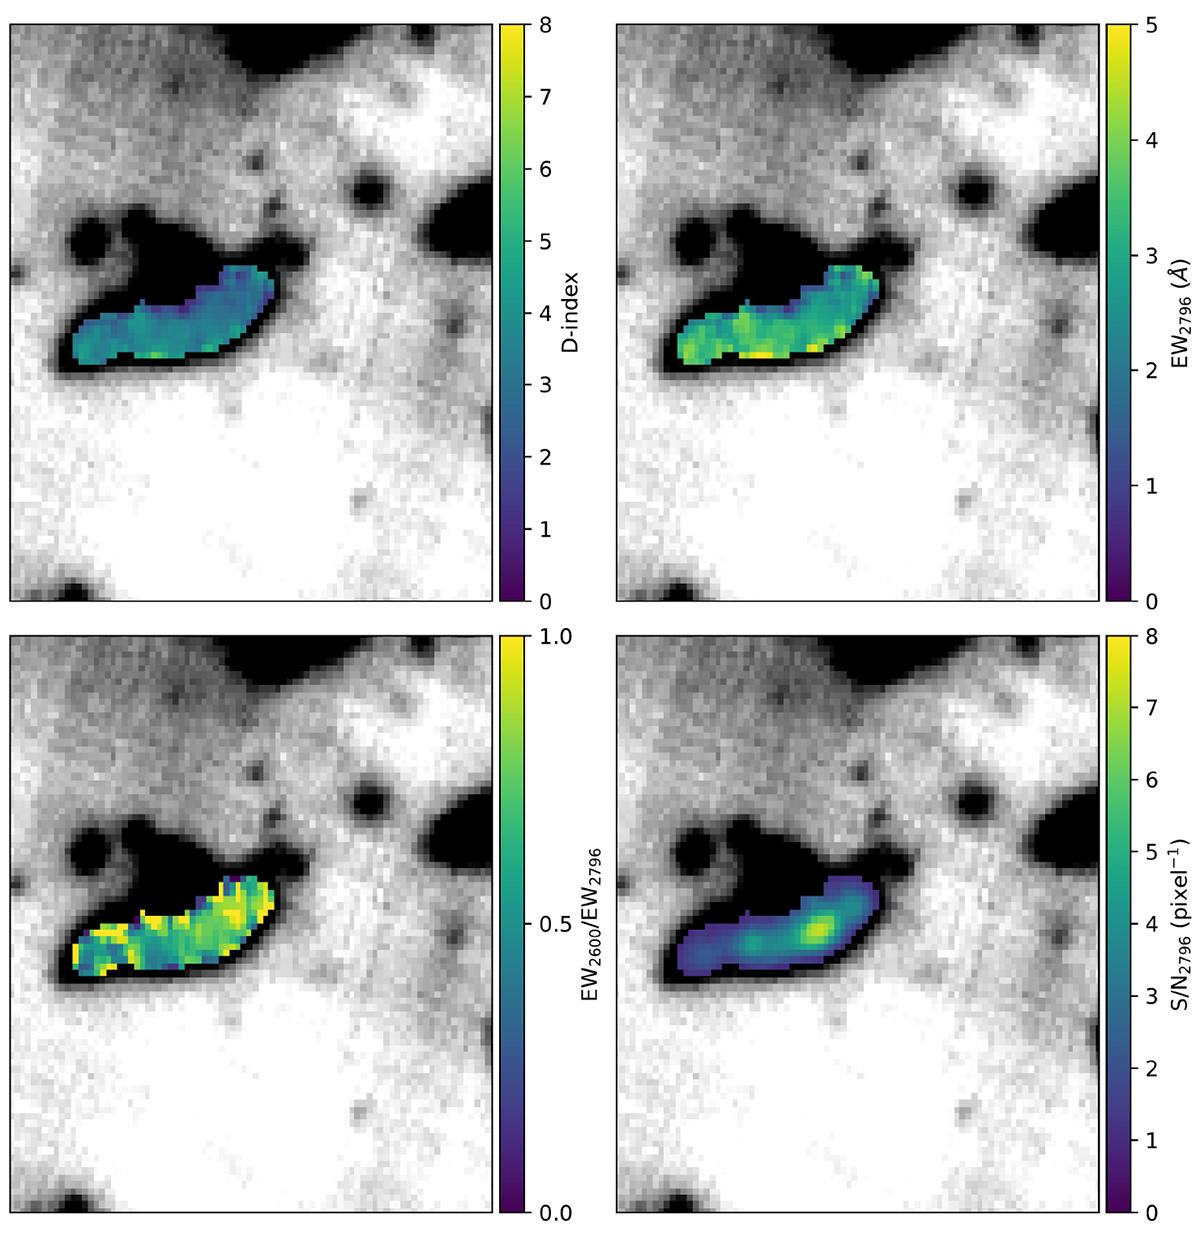
Fig. 3.
Download original image
Color maps of the lensed region in the J1527 field, showing the gravitational arc tracing Mg II absorption. The notation is the same as in Fig. 2. Only spaxels with S/N ≥1 at the position of Mg II 2796 Å and a EW2796 detected at ≥2σ significance are colored in all four panels.
Current usage metrics show cumulative count of Article Views (full-text article views including HTML views, PDF and ePub downloads, according to the available data) and Abstracts Views on Vision4Press platform.
Data correspond to usage on the plateform after 2015. The current usage metrics is available 48-96 hours after online publication and is updated daily on week days.
Initial download of the metrics may take a while.