Fig. 4
Download original image
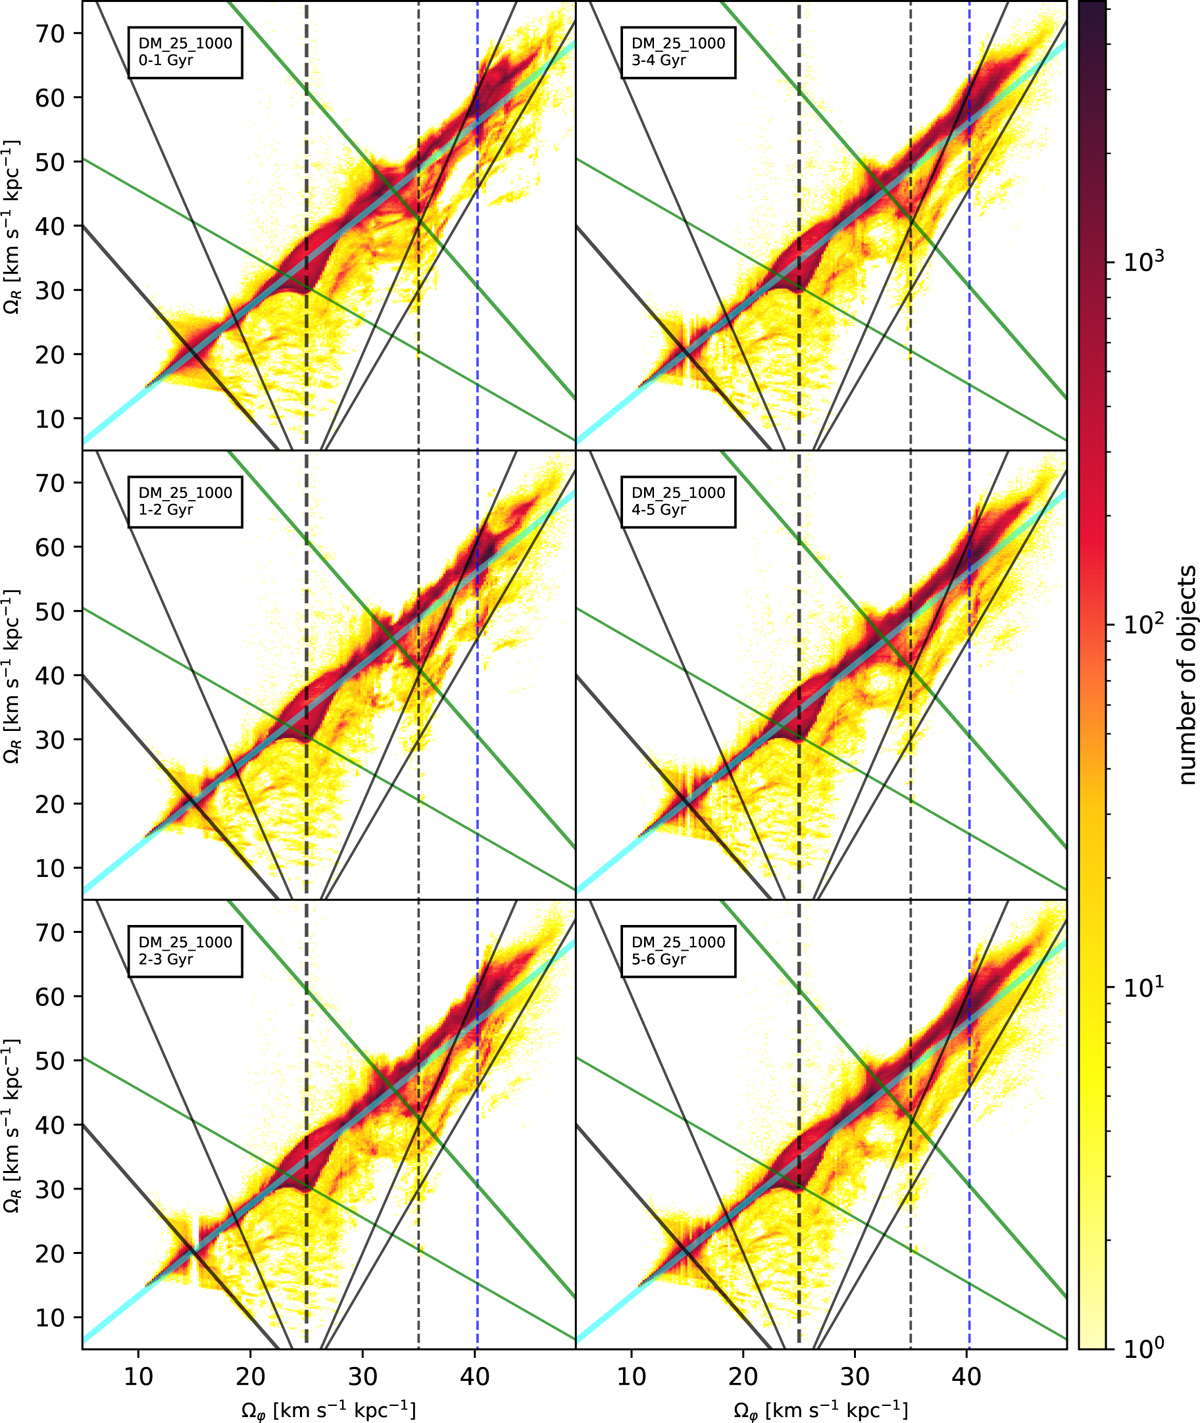
Time evolution of the frequency phase space with a time step of 1 Gyr for the simulation run DM_25_1000. The light blue curve indicates the epicycle approximation. Displayed resonances include spiral arm co-rotation resonances, m = p = 1 and m = 5, p = 7 (thick and thin dashed grey lines, respectively), the co-rotation resonance m = 2, p = 1 with the superposition of the spiral arms and the galactic bar (dashed blue line), the OLR with the spiral arms (thick solid grey line), the OLR with the galactic bar (thick solid green line), a bar resonance of l = m = p = 1 (thin green line), and spiral arm resonances of l = −1, m = p = 4, l = −1, m = p = 3, and l = 1, m = p = 4 (thin solid grey lines).
Current usage metrics show cumulative count of Article Views (full-text article views including HTML views, PDF and ePub downloads, according to the available data) and Abstracts Views on Vision4Press platform.
Data correspond to usage on the plateform after 2015. The current usage metrics is available 48-96 hours after online publication and is updated daily on week days.
Initial download of the metrics may take a while.