Fig. 1
Download original image
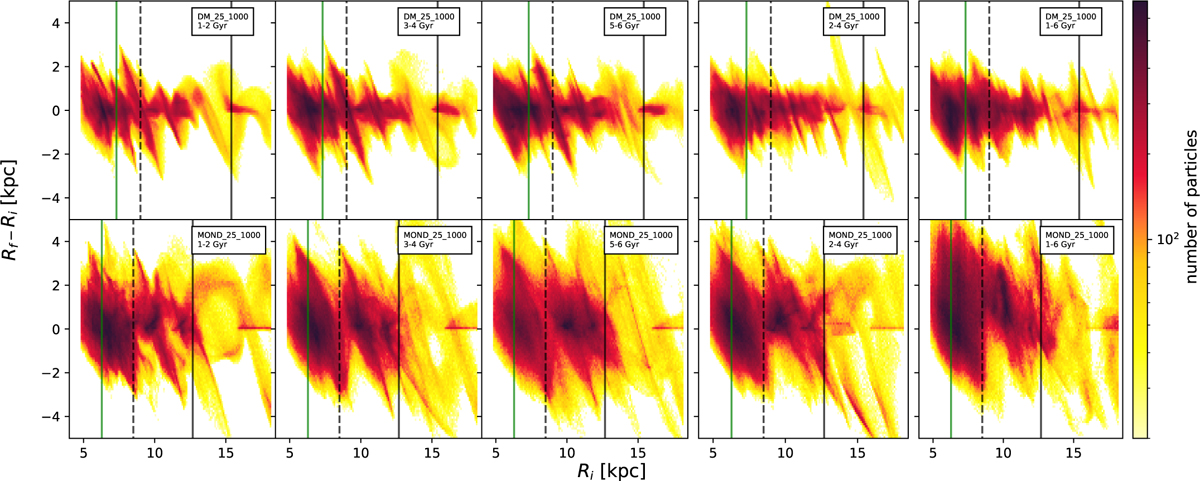
Distribution of changes in galactocentric radius, Rf − Ri , as a function of Ri for different time intervals during the 6 Gyr integration. The upper panel represents the simulation run DM_25_1000; the lower panel represents the simulation run MOND_25_1000 (corresponding parameters as listed in Tables 1 and 2). Vertical lines represent theoretical values of resonances: green lines represent resonances produced by the galactic bar, and grey lines represent resonances caused by the spiral arms. In both cases, the solid lines represent OLRs and the dashed line the m = p = 1 co-rotation resonance.
Current usage metrics show cumulative count of Article Views (full-text article views including HTML views, PDF and ePub downloads, according to the available data) and Abstracts Views on Vision4Press platform.
Data correspond to usage on the plateform after 2015. The current usage metrics is available 48-96 hours after online publication and is updated daily on week days.
Initial download of the metrics may take a while.