Fig. 6.
Download original image
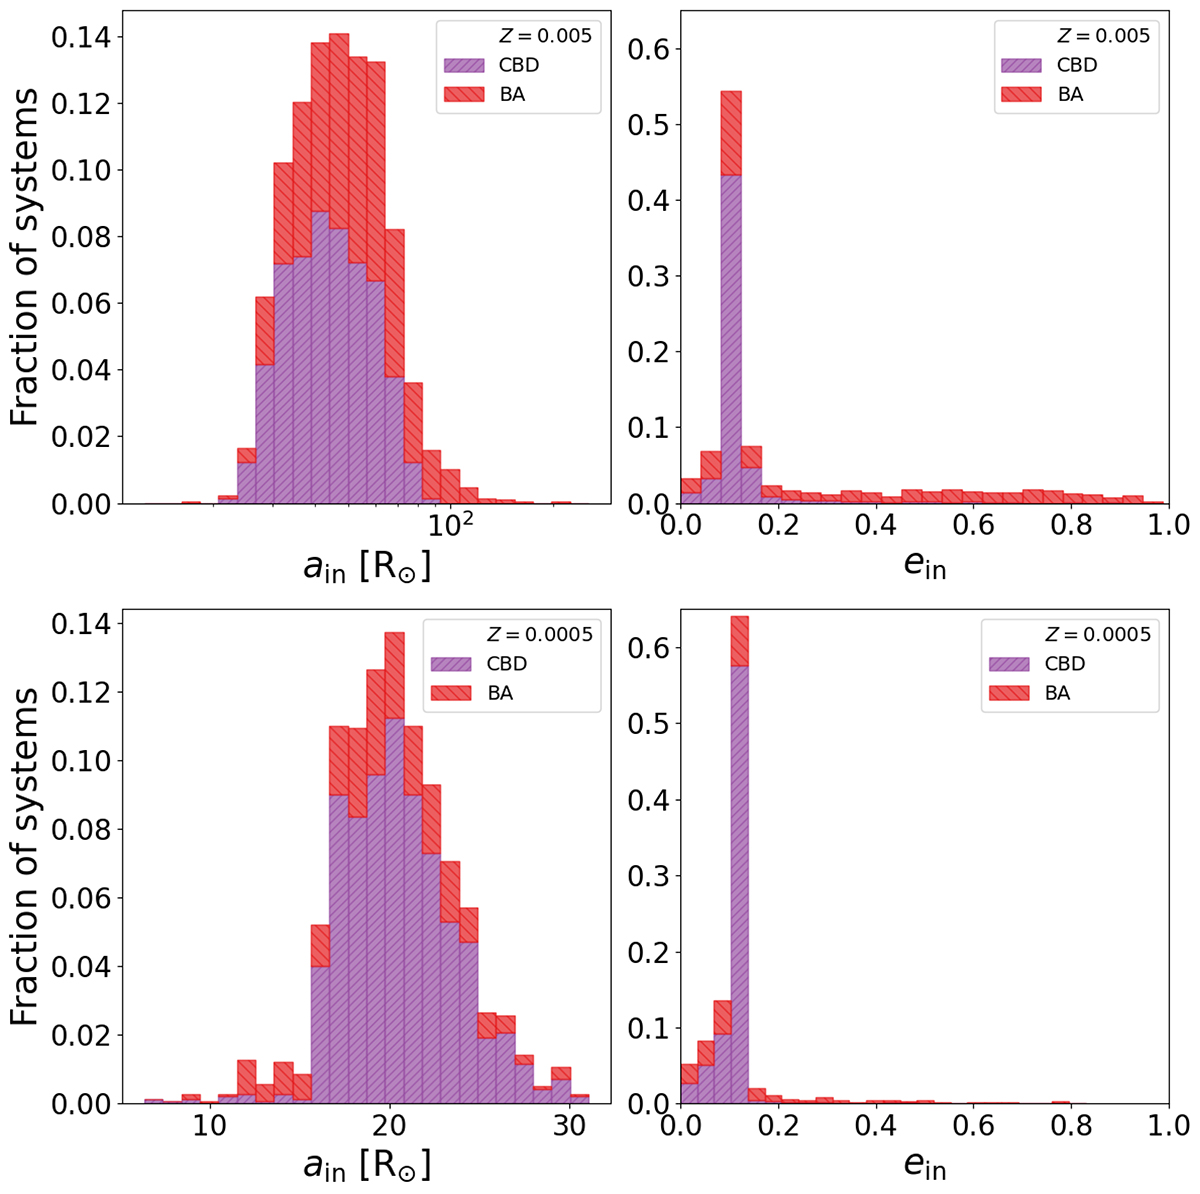
Distribution of the semi-major axis and eccentricity of the inner binaries with a metallicity of Z = 0.005 (top) and Z = 0.0005 (bottom) at the onset of TMT. The purple and red shaded regions correspond to systems that start the TMT phase with the formation of a CBD and BA, respectively. The red bars are plotted on top of the purple bars. We note that the range of the semi-major axis is different between the upper and lower panel.
Current usage metrics show cumulative count of Article Views (full-text article views including HTML views, PDF and ePub downloads, according to the available data) and Abstracts Views on Vision4Press platform.
Data correspond to usage on the plateform after 2015. The current usage metrics is available 48-96 hours after online publication and is updated daily on week days.
Initial download of the metrics may take a while.