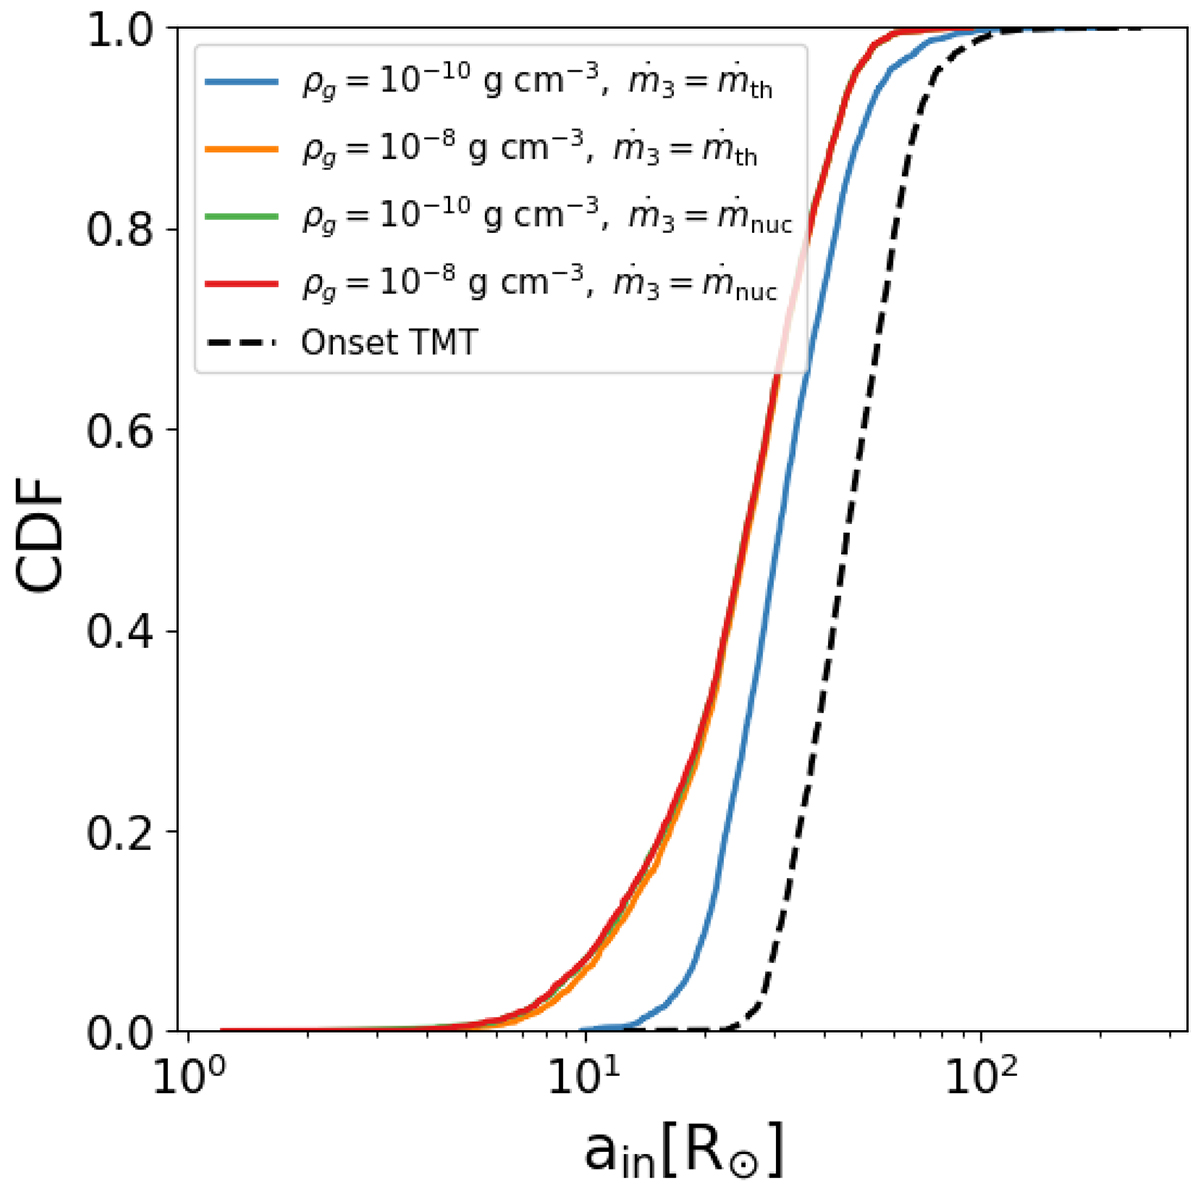
Fig. 5.
Download original image
Cumulative distribution of the semi-major axis of the inner binaries at the end of TMT for Model Basic at Z = 0.005. The few systems that have merged during TMT are omitted. The black dashed line denotes the semi-major axis distribution at the onset of mass transfer. Among different assumption for the gas density during BA and the mass transfer rate, the final distributions are fairly similar.
Current usage metrics show cumulative count of Article Views (full-text article views including HTML views, PDF and ePub downloads, according to the available data) and Abstracts Views on Vision4Press platform.
Data correspond to usage on the plateform after 2015. The current usage metrics is available 48-96 hours after online publication and is updated daily on week days.
Initial download of the metrics may take a while.