Fig. 8.
Download original image
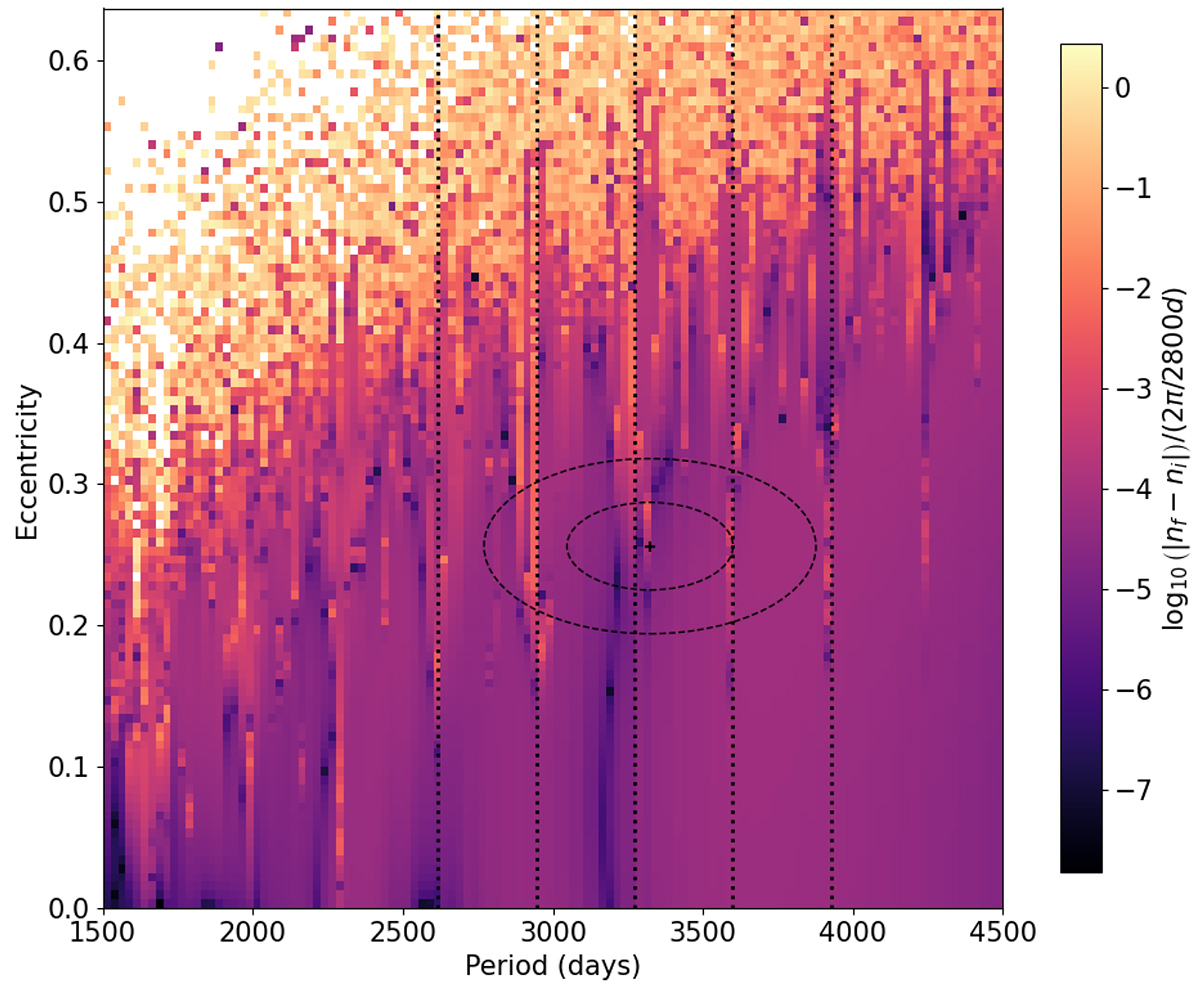
Chaos map representing the variation of the proper mean motion |nf − ni| between two halves of a 2000-year integration on a grid of 120 × 120 initial conditions in the period-eccentricity plane of the planet. White pixels represent orbits that are so chaotic that we could not run the frequency analysis. The eccentricity grid initially went all the way to 0.9, but we show here only the 102 lower values, as nearly all pixels in the last 18 lines are white. Vertical dotted lines show the positions of resonances 8:1 to 12:1 with the outer-binary period. The cross shows the mean parameters of the planet as reported in Table E.1, and the ellipses represent the one and two-sigma confidence regions, respectively.
Current usage metrics show cumulative count of Article Views (full-text article views including HTML views, PDF and ePub downloads, according to the available data) and Abstracts Views on Vision4Press platform.
Data correspond to usage on the plateform after 2015. The current usage metrics is available 48-96 hours after online publication and is updated daily on week days.
Initial download of the metrics may take a while.