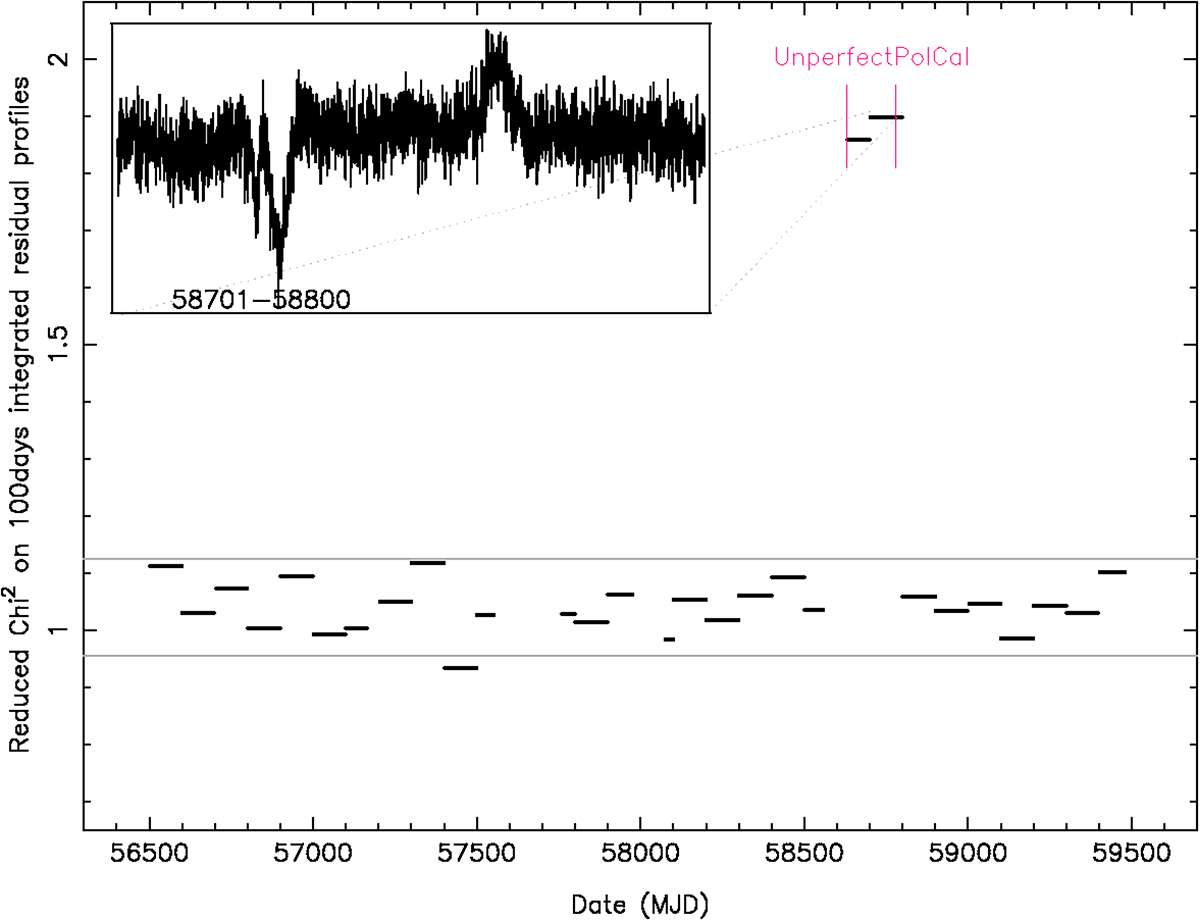
Fig. 7.
Download original image
Reduced χ2 of the residuals between each 100-day sub-profile and the main template as a function of date. Two sub-profiles are in the time interval when imperfect polarisation calibration was performed (‘UnperfectPolCal’, see main text). The inset shows the residuals obtained for one of these sub-profiles, while others do not show discernible structure (i.e. noise). The two horizontal lines delimit the two-standard-deviation interval around the mean of the reduced χ2 distribution corresponding to σred.χ2 ≃ 0.043 (imperfect polarisation region excluded).
Current usage metrics show cumulative count of Article Views (full-text article views including HTML views, PDF and ePub downloads, according to the available data) and Abstracts Views on Vision4Press platform.
Data correspond to usage on the plateform after 2015. The current usage metrics is available 48-96 hours after online publication and is updated daily on week days.
Initial download of the metrics may take a while.