Fig. E.1.
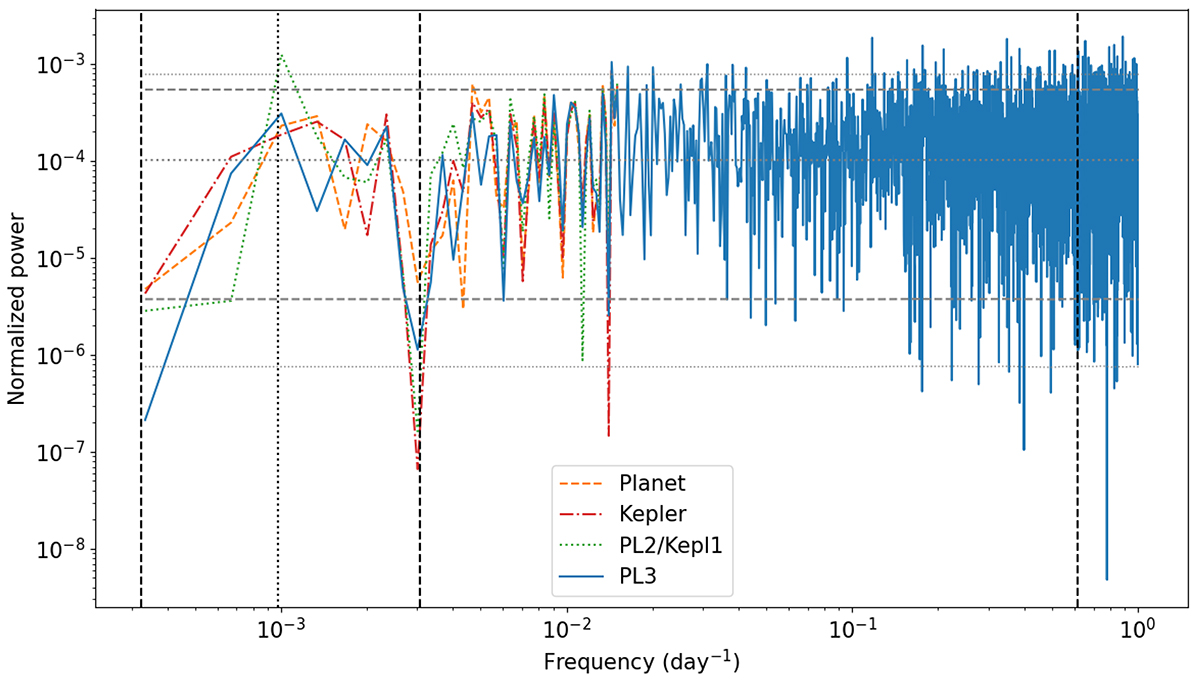
Download original image
Periodogram of the post-fit residuals, sampled at 1/T where T is the time span of observations, and ranging in frequency from 1/T to 1 day−1. Vertical dashed lines represent the best-fit planet orbital frequency, outer binary and inner binary orbital frequencies, from left to right. The vertical dotted line marks the third harmonic of the planet orbital frequency. Horizontal grey lines describe the 95% region obtained by bootstrapping white noise: the central dotted line is the median, dashed lines delineate the 2.5% and 97.5% levels, and thin dotted lines the 0.5% to 99.5% interval. For clarity, these lines have been smoothed as they are otherwise noisy. In the low-frequency part of the plot, until 5/PO ≃ 1.5 × 10⁻² day−1 where PO is the outer binary period, we show the periodograms of the planet (dashed orange), Kepler (dash-dotted red), PL2/Kepl1 (dotted green), and PL3 (solid blue) models. In the higher frequency part only PL3 is shown for clarity as the difference with other models becomes much smaller.
Current usage metrics show cumulative count of Article Views (full-text article views including HTML views, PDF and ePub downloads, according to the available data) and Abstracts Views on Vision4Press platform.
Data correspond to usage on the plateform after 2015. The current usage metrics is available 48-96 hours after online publication and is updated daily on week days.
Initial download of the metrics may take a while.