Open Access
Fig. D.1.
Download original image
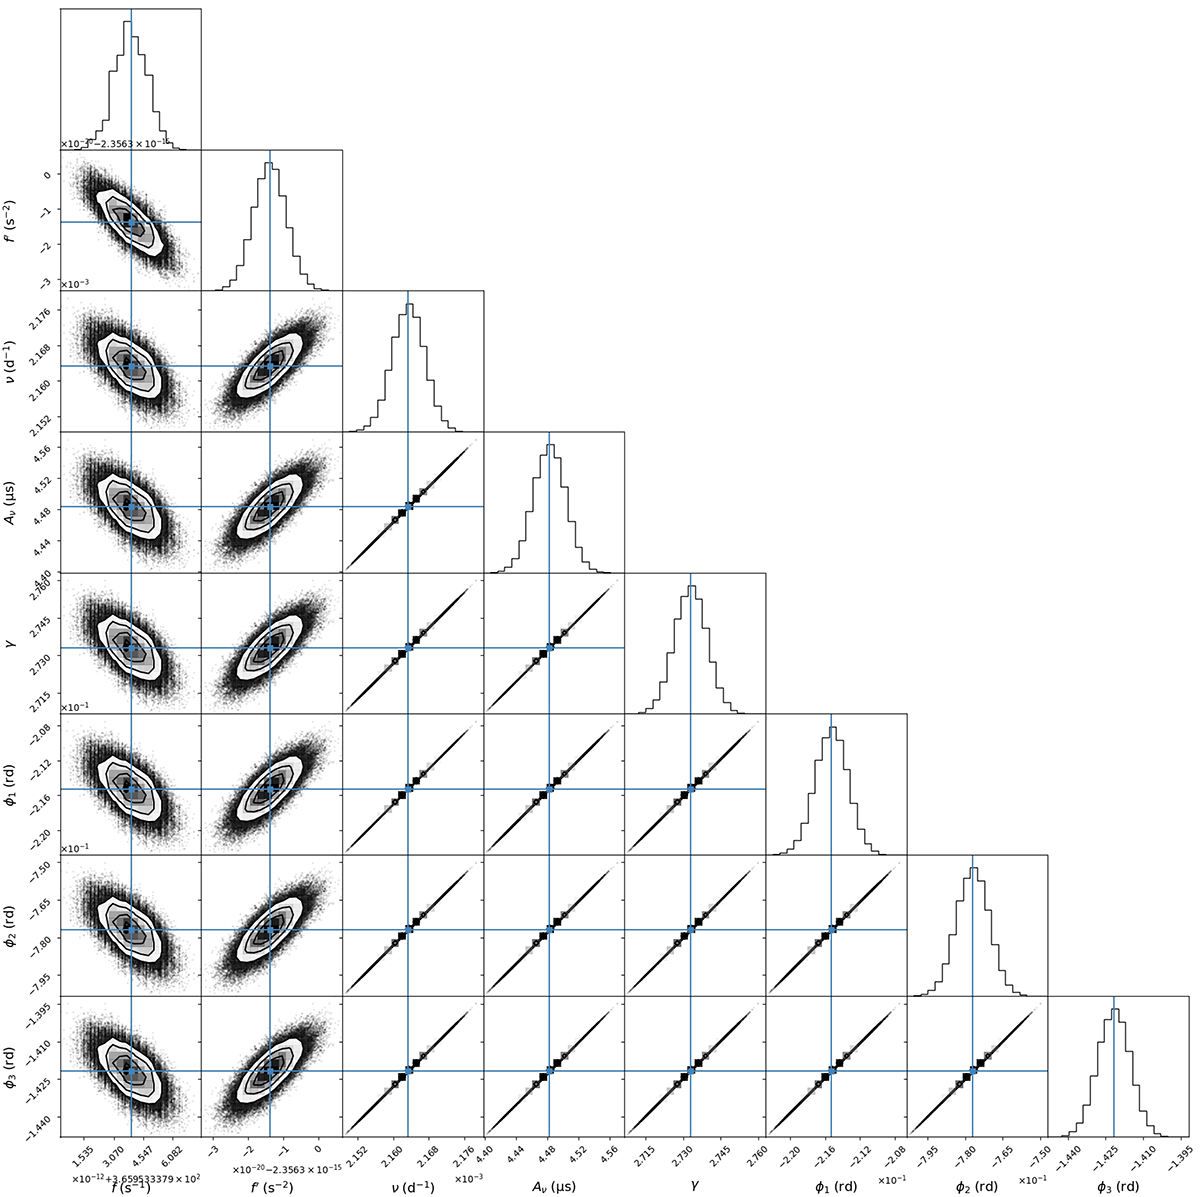
Correlation plot of the posterior distribution function of the PL3 model using the corresponding MCMC-generated sample, and restricted to ![]() ,
, ![]() as well as PL3 specific parameters.
as well as PL3 specific parameters.
Current usage metrics show cumulative count of Article Views (full-text article views including HTML views, PDF and ePub downloads, according to the available data) and Abstracts Views on Vision4Press platform.
Data correspond to usage on the plateform after 2015. The current usage metrics is available 48-96 hours after online publication and is updated daily on week days.
Initial download of the metrics may take a while.