Fig. 8.
Download original image
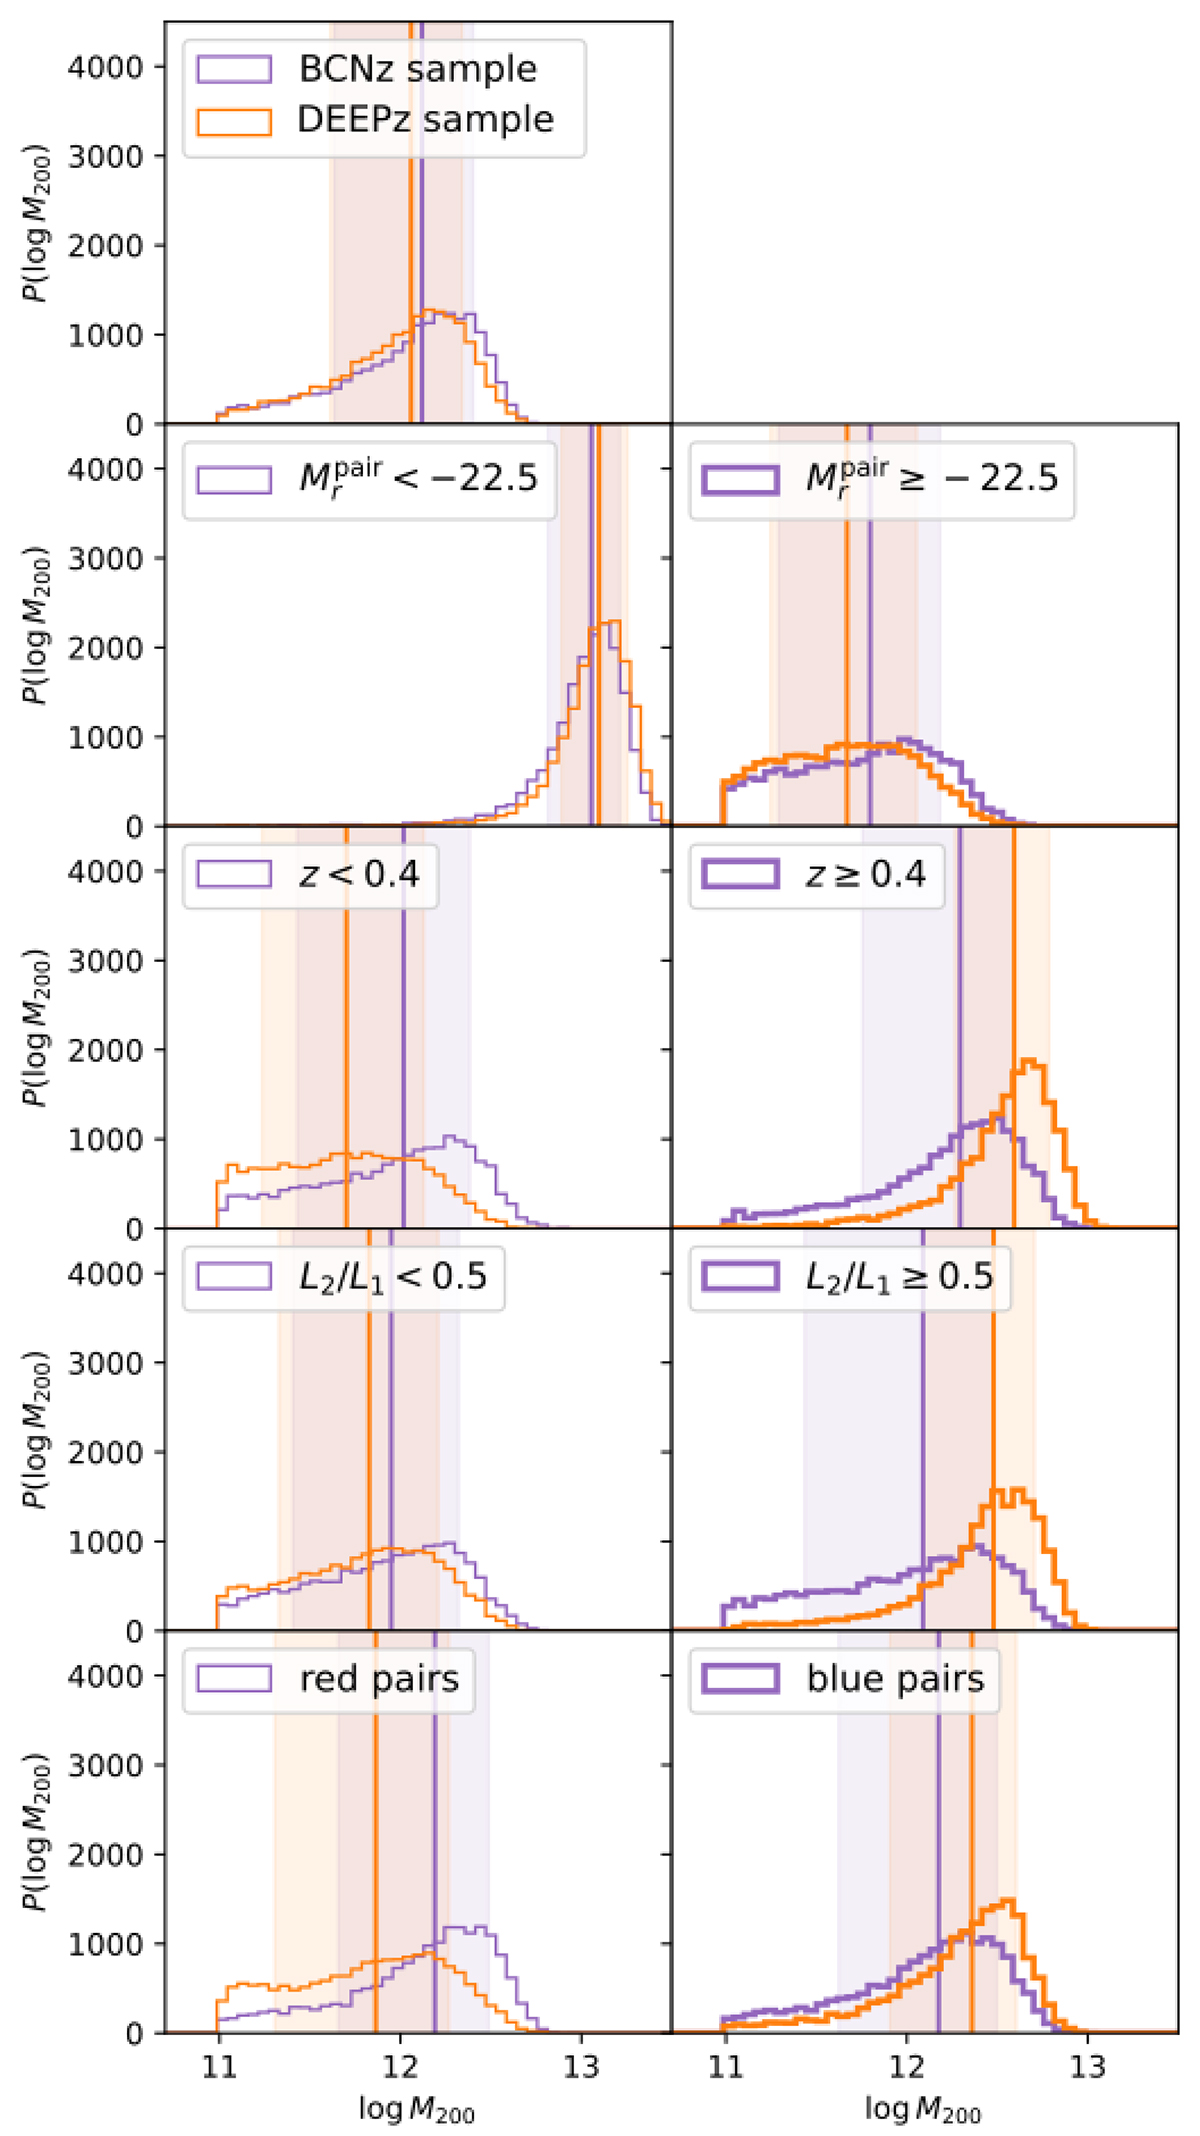
Posterior density distributions of the fitted log M200. Each row shows the distributions for the pairs selected from the BCNz2 and DEEPz methods in purple and orange, respectively. The selection cuts according to pair properties are shown using thicker and narrower lines as referred to in the legends. Vertical lines indicate the median values and the shaded regions enclose 68% of the distributions corresponding to the errors. In each panel, the stacked pair sub-sample described in Table 3 is specified.
Current usage metrics show cumulative count of Article Views (full-text article views including HTML views, PDF and ePub downloads, according to the available data) and Abstracts Views on Vision4Press platform.
Data correspond to usage on the plateform after 2015. The current usage metrics is available 48-96 hours after online publication and is updated daily on week days.
Initial download of the metrics may take a while.