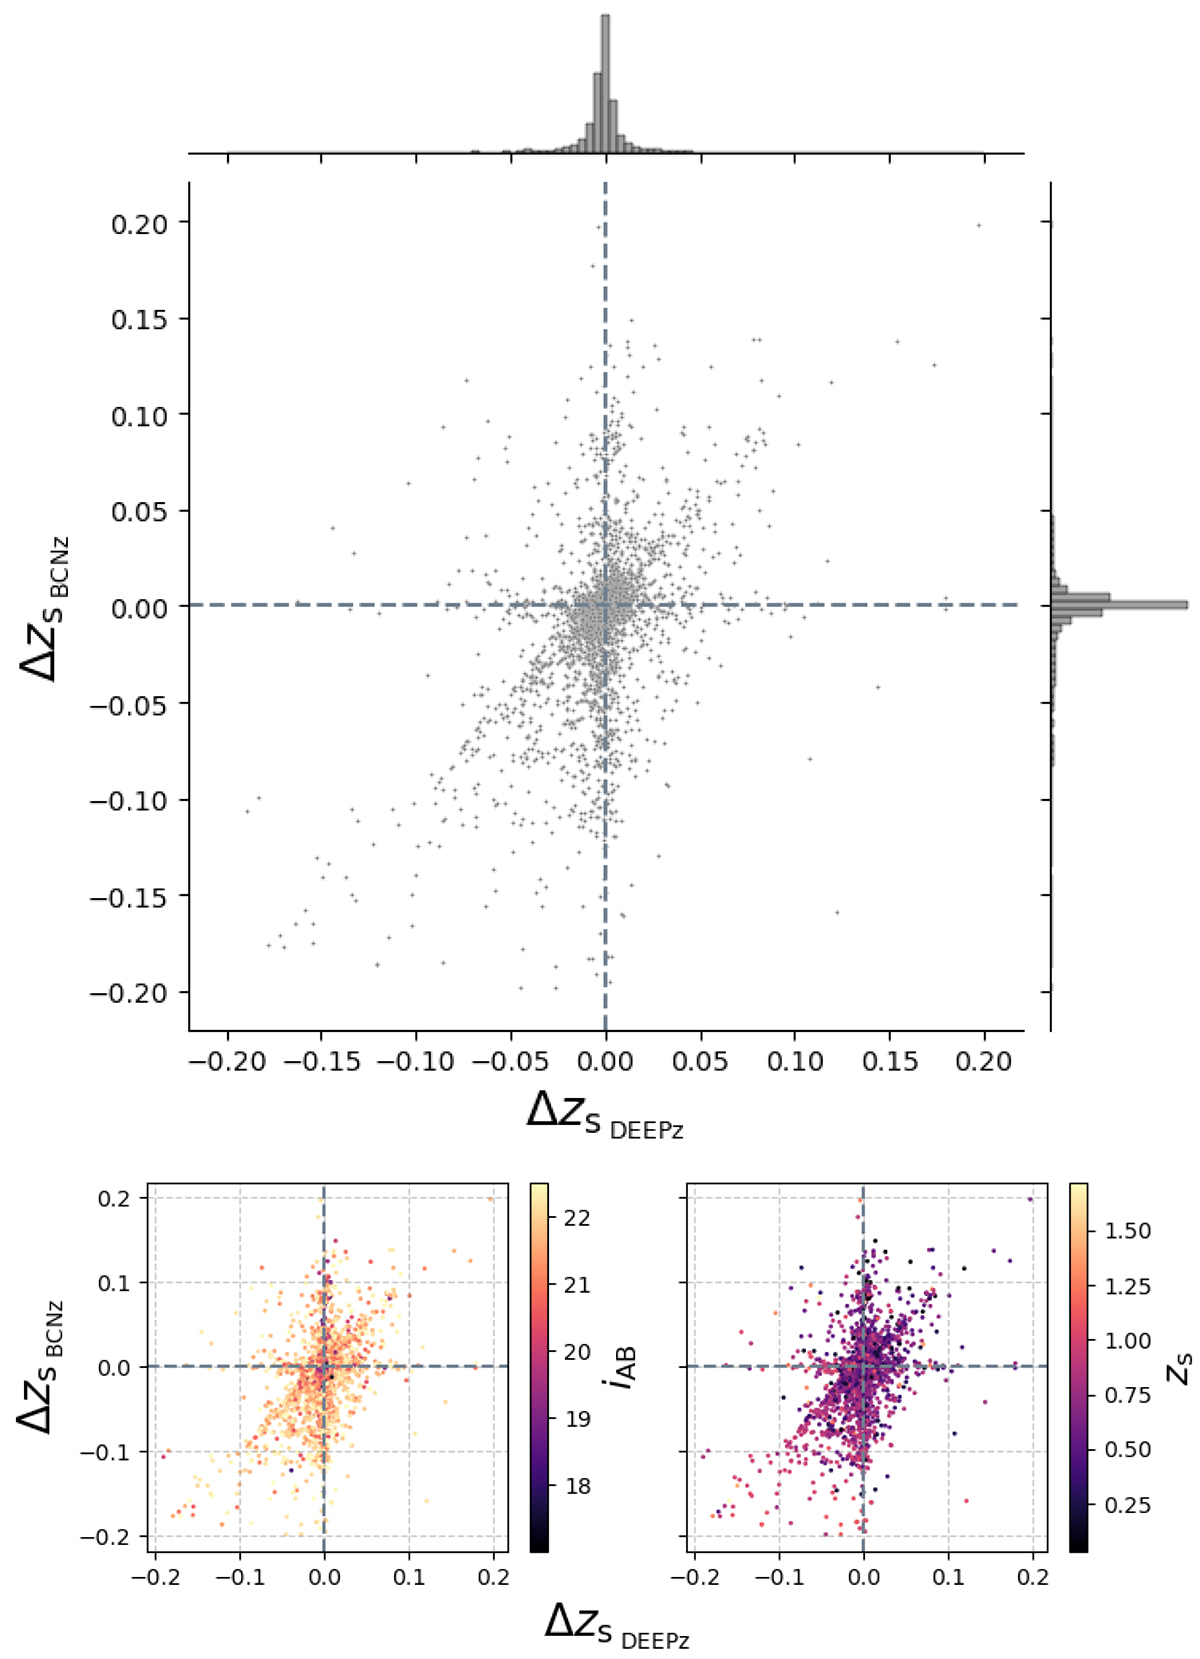
Fig. 7.
Download original image
Scatter plots of errors on the x-axis for the DEEPz method and on the y-axis for the errors obtained when determining zp using the BCNz2 method. Top panel: scatter plot of errors for each method along with a histogram showing the distribution of points along each axis. Bottom-left panel: scatter plot of errors for each method colour-coded according to the apparent magnitude in the i-band. Bottom-right panel: scatter plot of errors for each method colour-coded according to zs.
Current usage metrics show cumulative count of Article Views (full-text article views including HTML views, PDF and ePub downloads, according to the available data) and Abstracts Views on Vision4Press platform.
Data correspond to usage on the plateform after 2015. The current usage metrics is available 48-96 hours after online publication and is updated daily on week days.
Initial download of the metrics may take a while.