Fig. 6.
Download original image
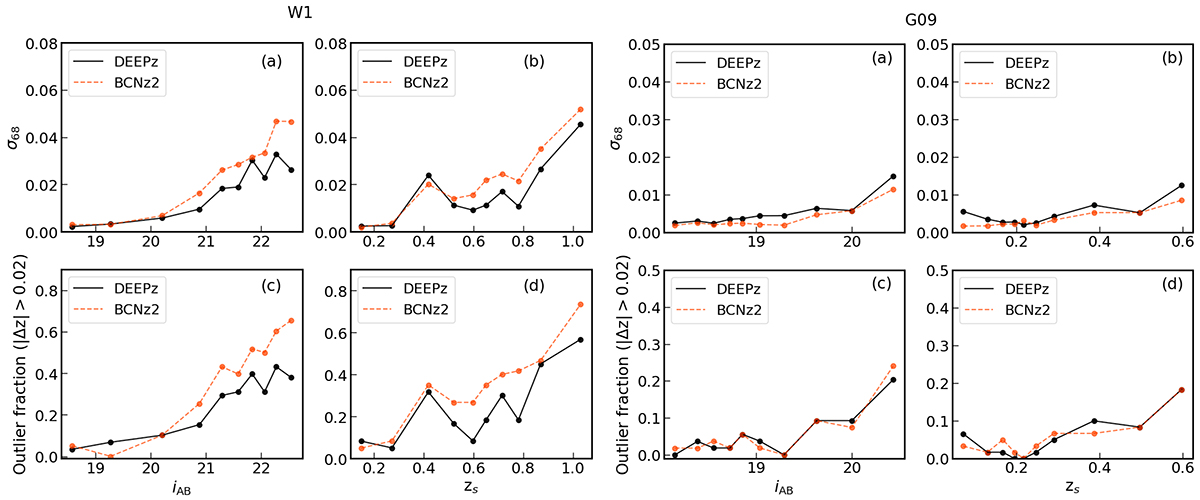
Comparison of the σ68 values (top row) and outlier fractions (bottom row) for the W1 and G09 samples obtained using the DEEPz and BCNz2 methods. Columns (1) and (2) correspond to the implementation of the model trained with the W1 sample with missing NB values inferred. Columns (3) and (4) correspond to the implementation of the model trained with the G09+COSMOS sample with missing NB flues inferred. Upper panels (a) and (b): σ68 for DEEPz and BCNz2 plotted against i-band magnitude for (a) and against redshift for (b). Lower panels (c) and (d): Fraction of outliers with Δz > 0.02 plotted as a function of i-band magnitude for (c) and redshift for (d).
Current usage metrics show cumulative count of Article Views (full-text article views including HTML views, PDF and ePub downloads, according to the available data) and Abstracts Views on Vision4Press platform.
Data correspond to usage on the plateform after 2015. The current usage metrics is available 48-96 hours after online publication and is updated daily on week days.
Initial download of the metrics may take a while.