Open Access
Fig. 5.
Download original image
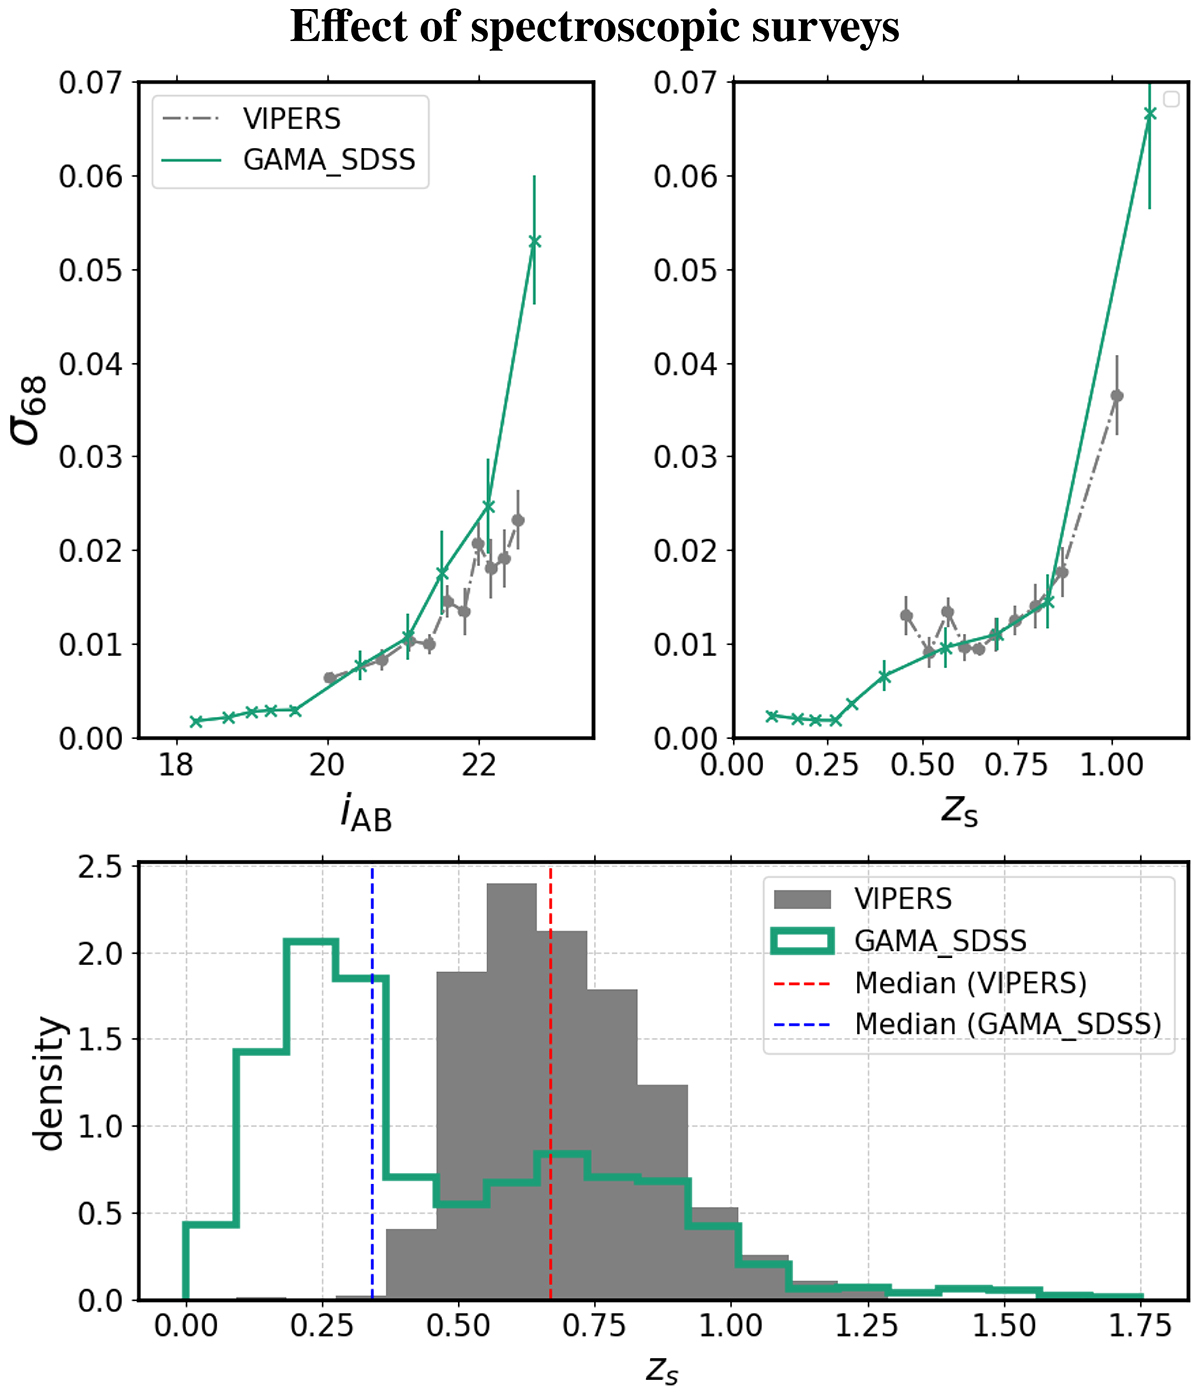
The upper panels show trends in the measurement of σ68 with respect to i (left panel) and zs (right panel). There are separate curves for the results using the VIPERS and GAMA_SDSS redshifts. The lower panel shows the spectroscopic redshift distribution from the VIPERS and GAMA_SDSS surveys in the W1 field.
Current usage metrics show cumulative count of Article Views (full-text article views including HTML views, PDF and ePub downloads, according to the available data) and Abstracts Views on Vision4Press platform.
Data correspond to usage on the plateform after 2015. The current usage metrics is available 48-96 hours after online publication and is updated daily on week days.
Initial download of the metrics may take a while.