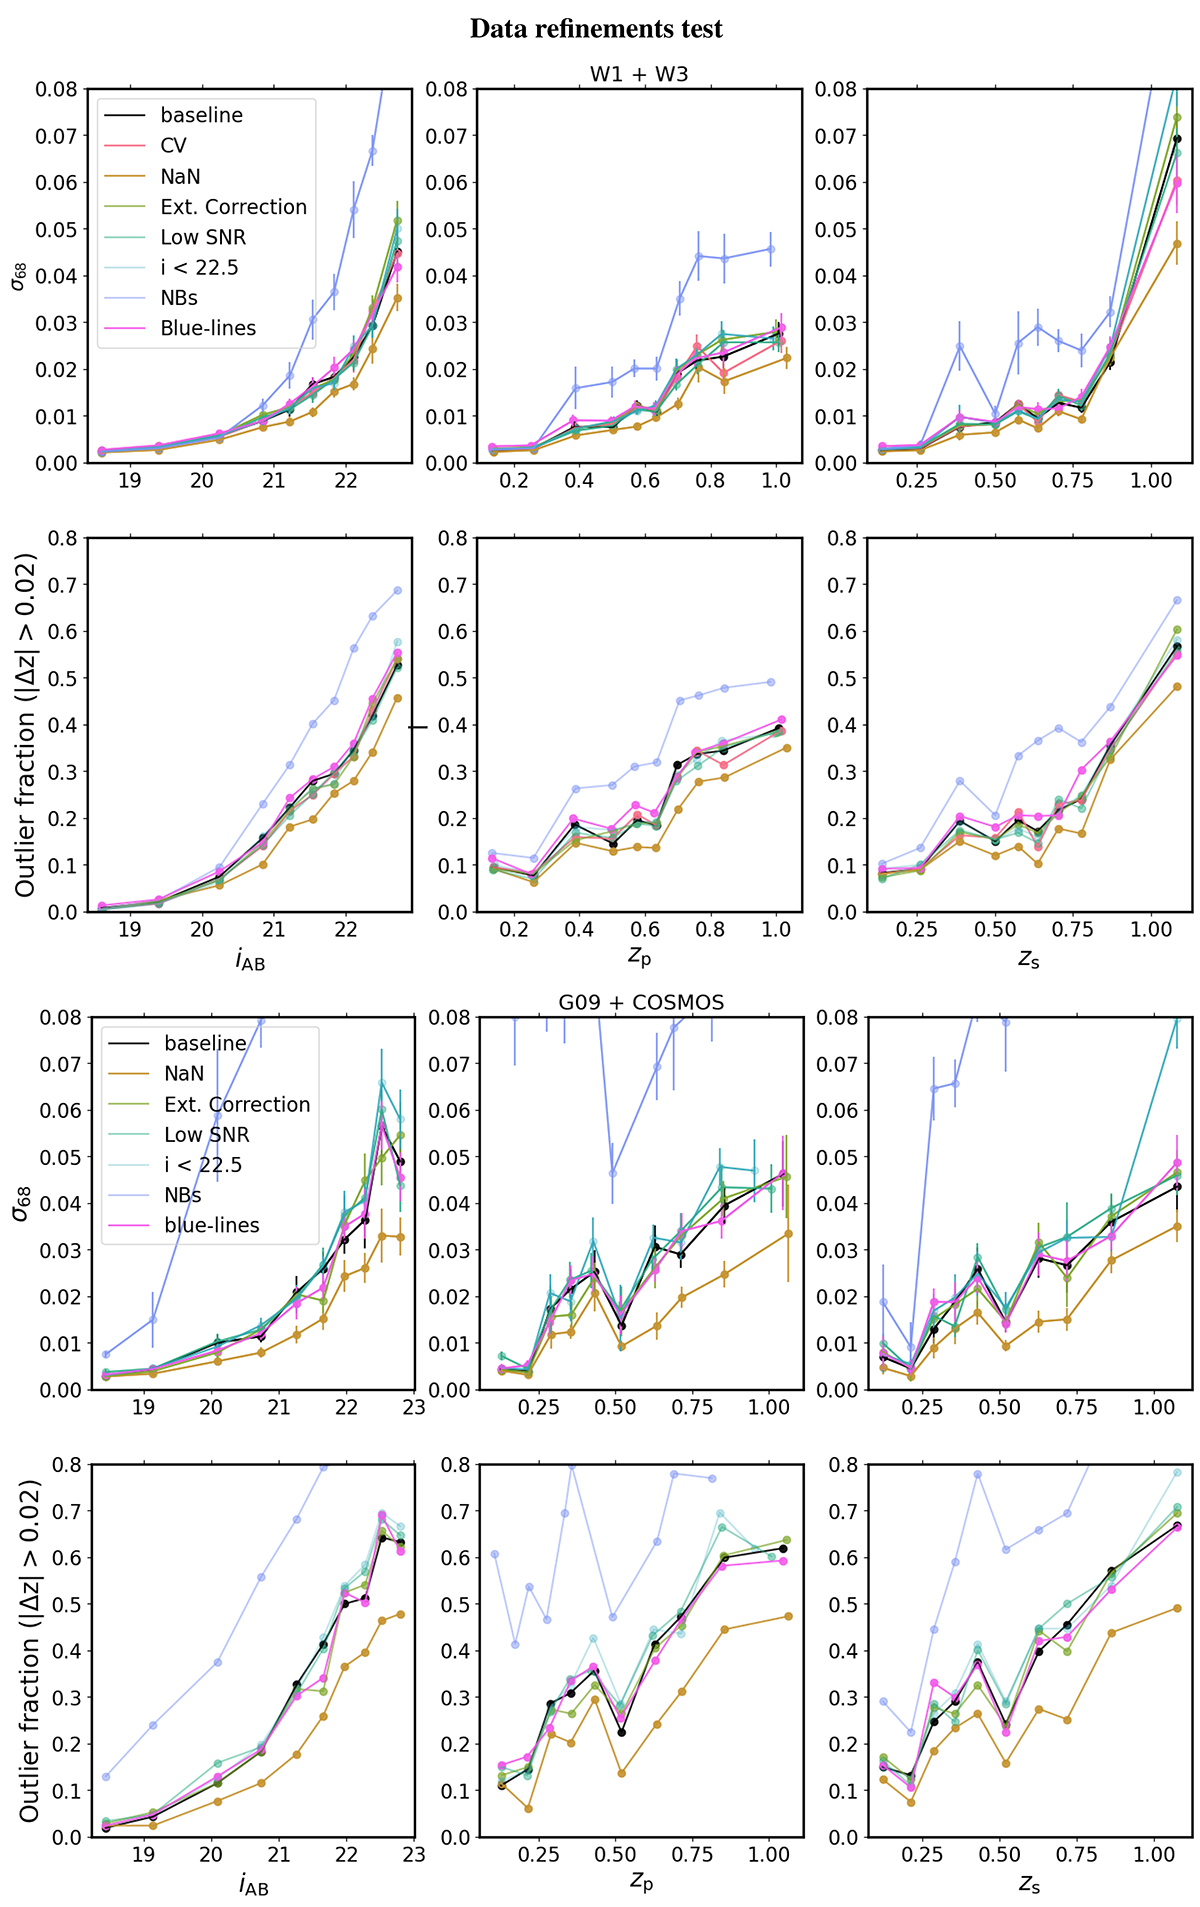
Fig. 4.
Download original image
The upper row depicts trends and variations in the measurement of σ68, while the lower row shows the fraction of outlier values. The distribution is divided into ten bins, each containing an equal number of objects, based on the magnitude in the i-band, zp, and zs, positioned in the left, centre, and right columns, respectively. These trends represent the findings from seven tests, summarised in Table 2, implemented on the W1+W3 and G09+COSMOS baseline samples.
Current usage metrics show cumulative count of Article Views (full-text article views including HTML views, PDF and ePub downloads, according to the available data) and Abstracts Views on Vision4Press platform.
Data correspond to usage on the plateform after 2015. The current usage metrics is available 48-96 hours after online publication and is updated daily on week days.
Initial download of the metrics may take a while.