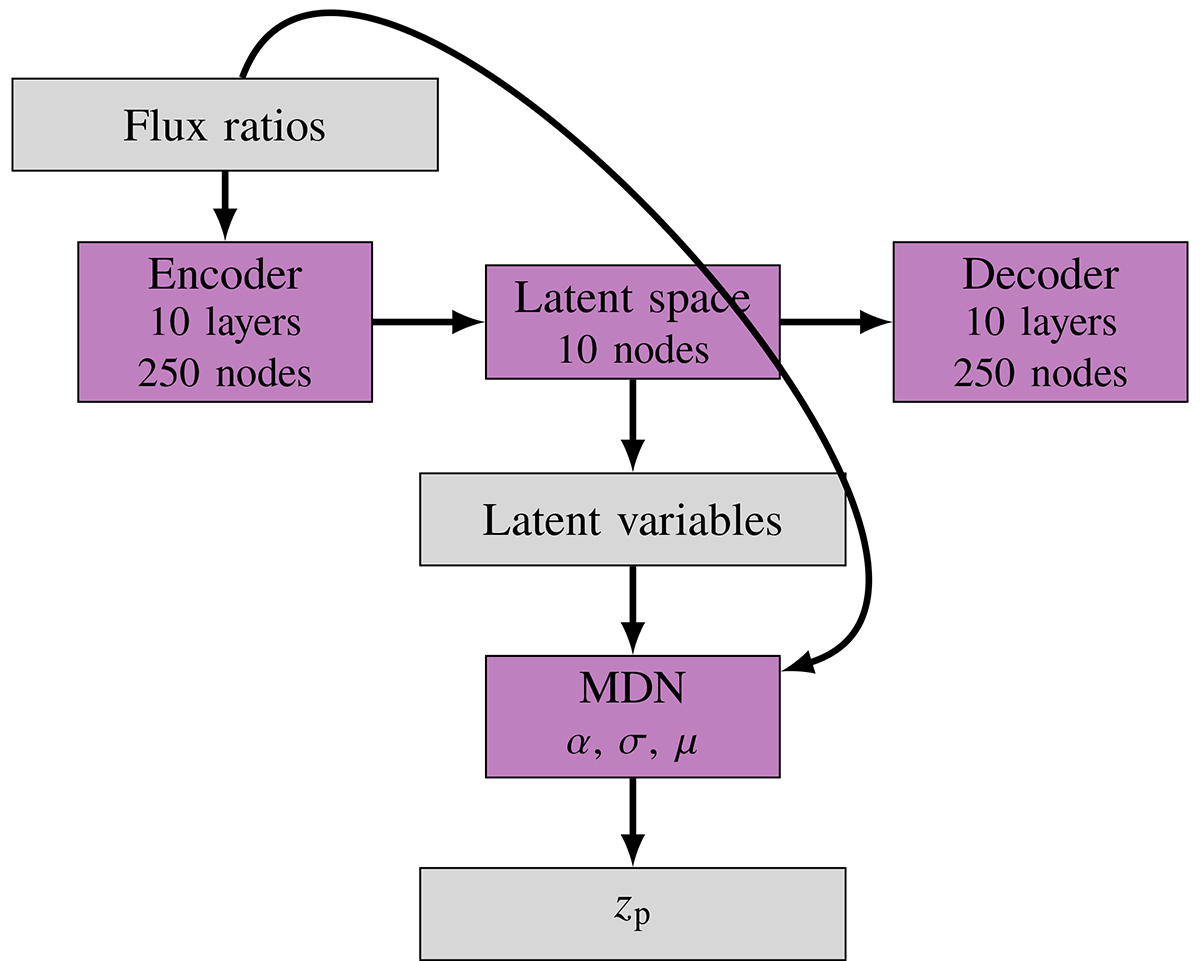
Fig. 2.
Download original image
DEEPz network flow diagram. The data are shown in grey and the networks in violet. The network architecture consists of an autoencoder with ten layers and 250 nodes in both the encoder and decoder. Each layer includes linear transformations followed by ReLU non-linearities, batch normalisation, and a 2% dropout, except for the last three layers. The autoencoder is fed galaxy flux ratios. The zp network, which follows the same structure as the autoencoder, takes both the galaxy flux ratios and autoencoder features as input. It includes 1% dropout after all linear layers. This network is a MDN, representing the redshift distribution as a linear combination of 10 normaldistributions.
Current usage metrics show cumulative count of Article Views (full-text article views including HTML views, PDF and ePub downloads, according to the available data) and Abstracts Views on Vision4Press platform.
Data correspond to usage on the plateform after 2015. The current usage metrics is available 48-96 hours after online publication and is updated daily on week days.
Initial download of the metrics may take a while.