Open Access
Fig. B.1.
Download original image
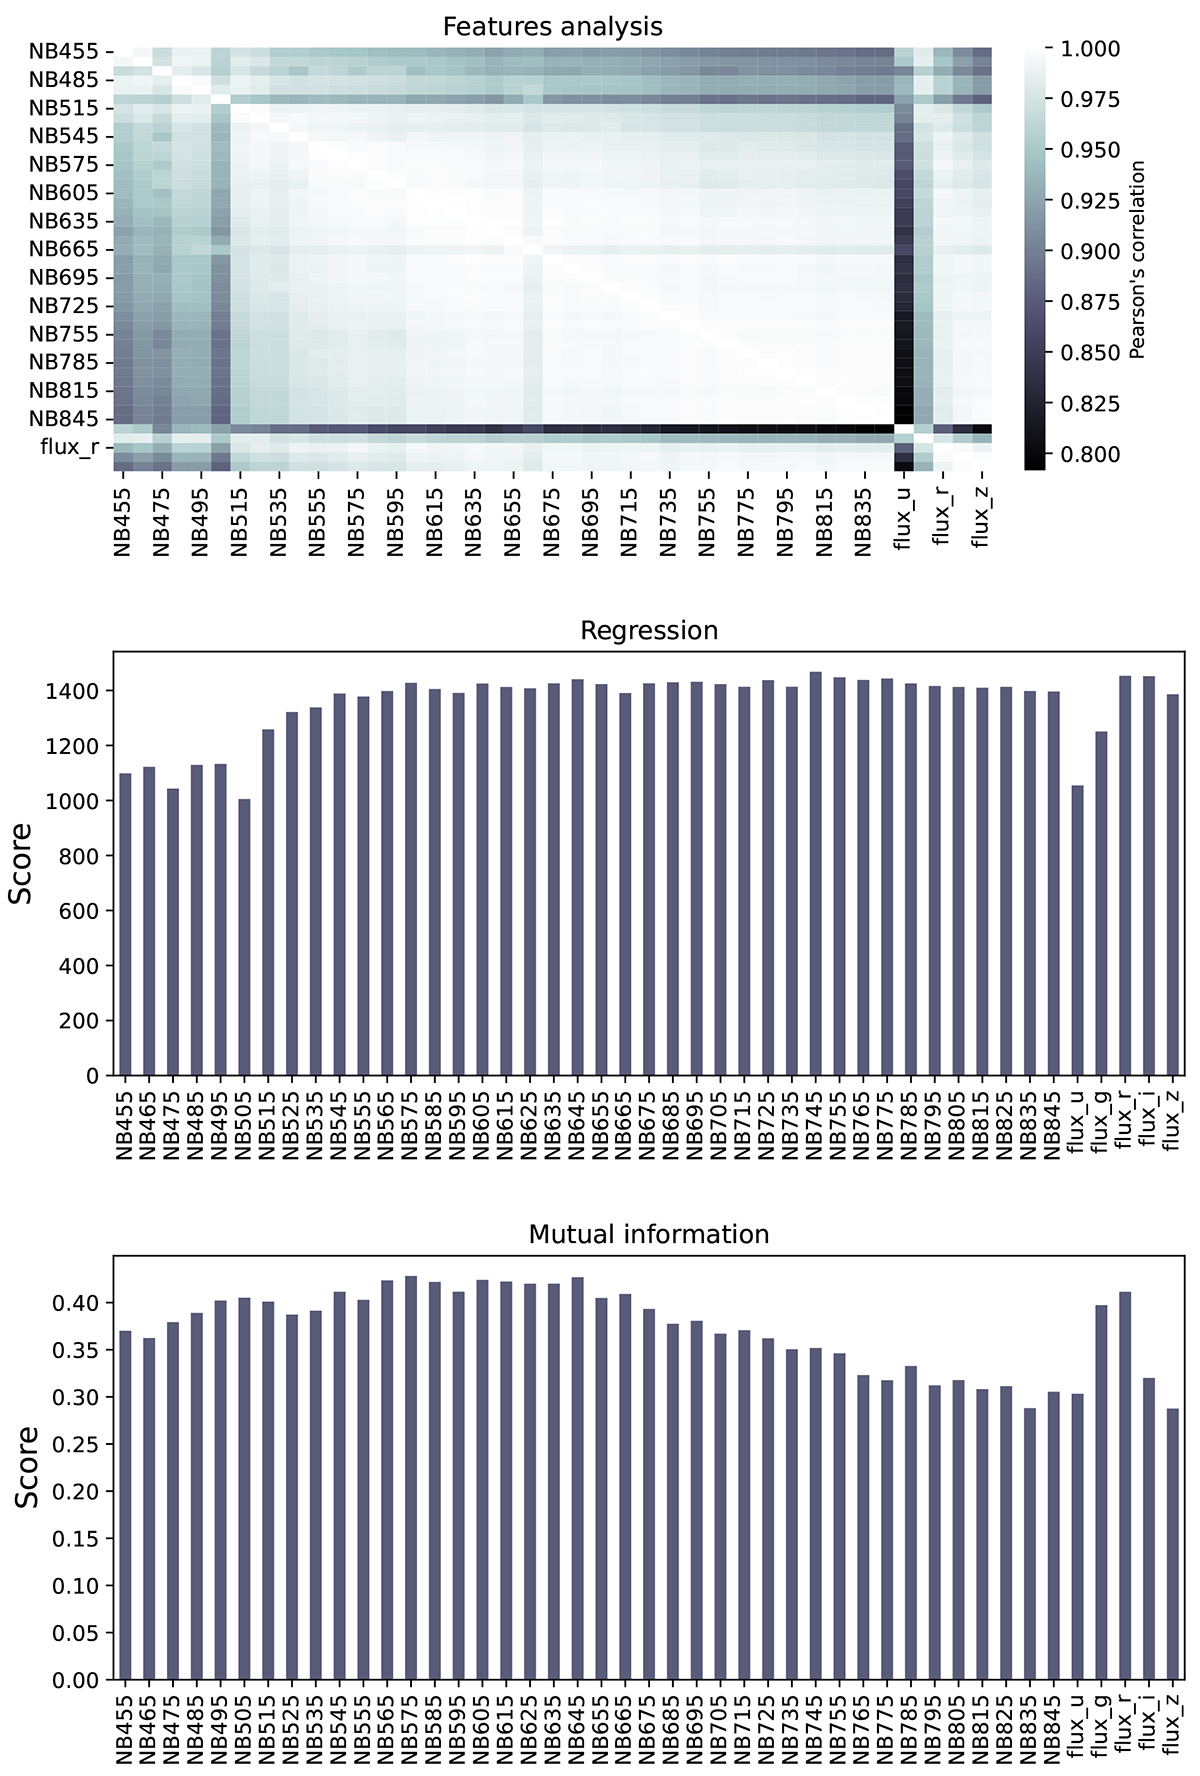
Visualisation of univariate study of bands used in W1 and W3 fields. Left panel: correlation among the bands through Pearson correlation. Central panel and right panel: bar chart of the scores of the correlated bands with the spectroscopic redshift bins calculated through MI and regression methods.
Current usage metrics show cumulative count of Article Views (full-text article views including HTML views, PDF and ePub downloads, according to the available data) and Abstracts Views on Vision4Press platform.
Data correspond to usage on the plateform after 2015. The current usage metrics is available 48-96 hours after online publication and is updated daily on week days.
Initial download of the metrics may take a while.