Fig. 9.
Download original image
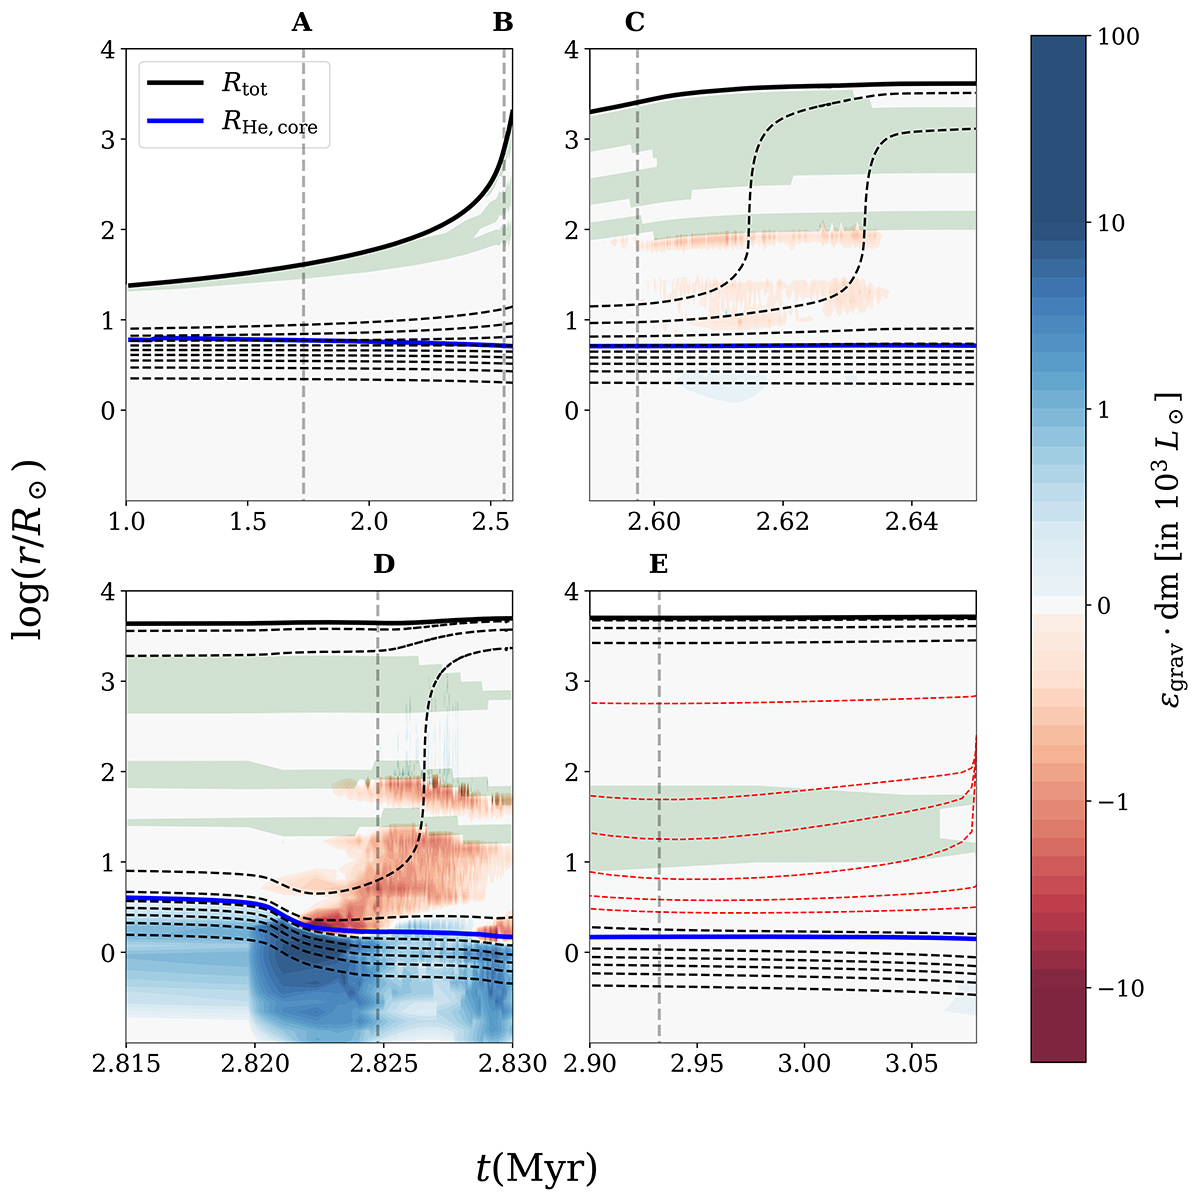
Radial Kippenhahn plot showing the internal profile evolution of the 100 M⊙ model. The solid black and blue lines are the total and core radii respectively. The black dashed lines track radius of constant q = m/Mtot = 0.1 − 0.9 in increments of 0.1. Additional constant q lines between q = 0.6 and 0.7 are also plotted in the bottom right plot. Blue and red contours are used to show positive (contracting) and negative (expanding) contributions of the local gravitational source term, ϵgrav. The green shading marks convective regions where |1 − Γrad|< 0.1, and β = Pgas/Ptot < 0.1. The four subplots correspond to (a) Inflation during the Main sequence phase (b) Expansion during the MS as the model loses thermal balance just below temperature of log(Teff/K) ∼3.8 (c) Expansion once the core runs out of hydrogen (d) Inflating layers inside the model during core-He burning.
Current usage metrics show cumulative count of Article Views (full-text article views including HTML views, PDF and ePub downloads, according to the available data) and Abstracts Views on Vision4Press platform.
Data correspond to usage on the plateform after 2015. The current usage metrics is available 48-96 hours after online publication and is updated daily on week days.
Initial download of the metrics may take a while.