Open Access
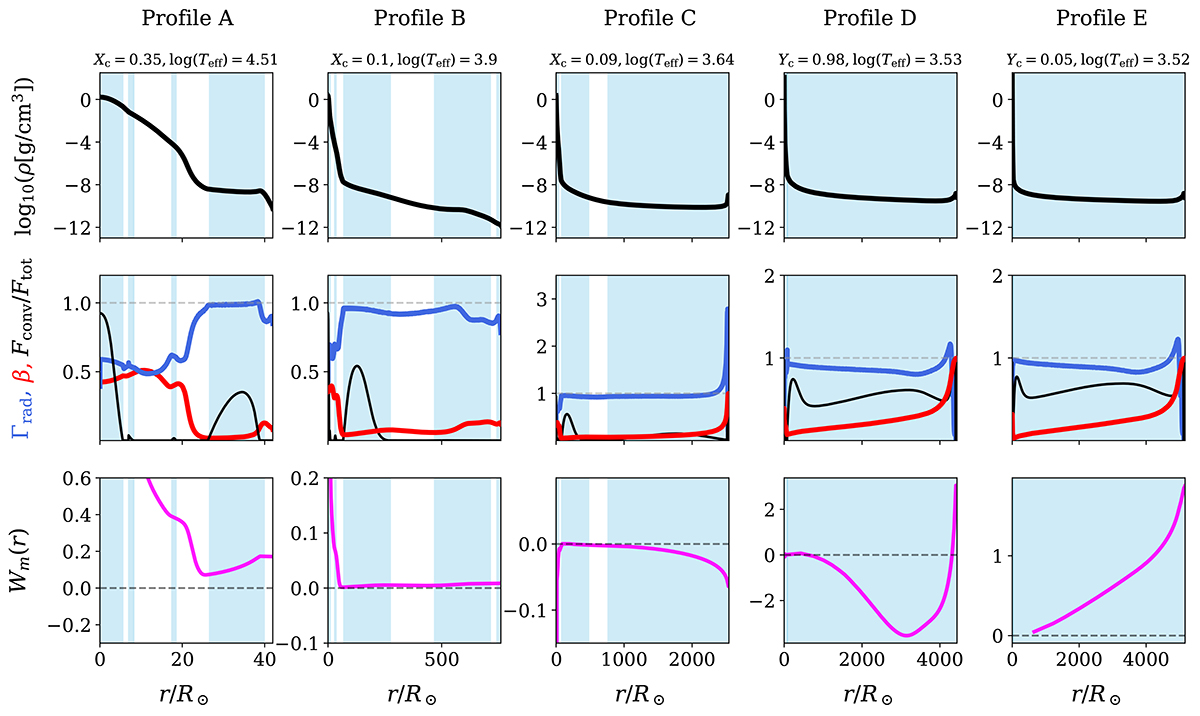
Fig. 8.
Download original image
Stratification of density (top row), local Γrad, gas-to-total pressure ratio β, convective flux fraction (middle row), and Wm (bottom row) for five profiles (A–E) taken at important phases of inflation and expansion of the 100 M⊙ model marked in Fig. 7. The blue shaded region indicates convectively unstable layers.
Current usage metrics show cumulative count of Article Views (full-text article views including HTML views, PDF and ePub downloads, according to the available data) and Abstracts Views on Vision4Press platform.
Data correspond to usage on the plateform after 2015. The current usage metrics is available 48-96 hours after online publication and is updated daily on week days.
Initial download of the metrics may take a while.