Fig. 7.
Download original image
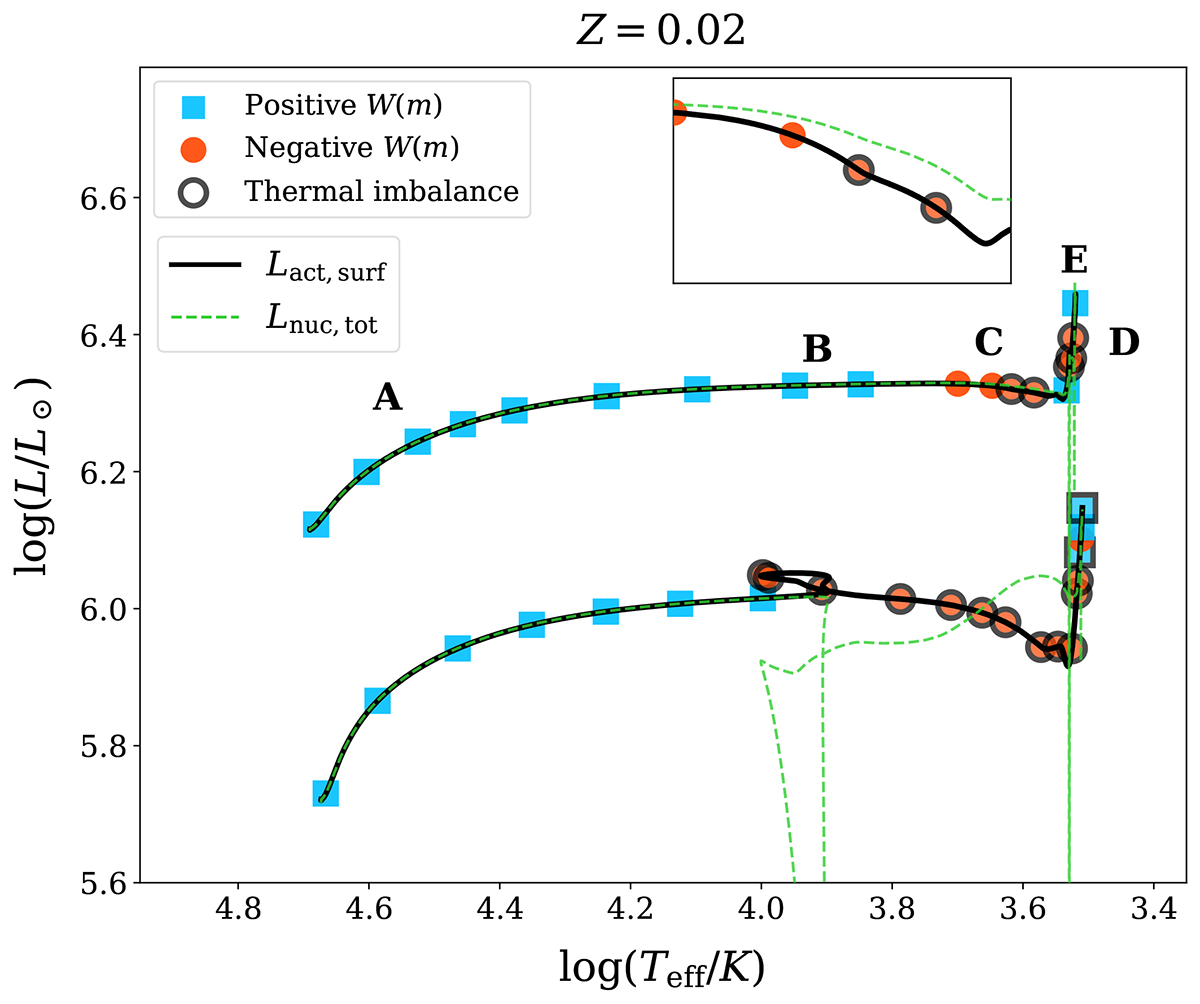
Hertzsprung-Russell diagram tracks of 60 and 100 M⊙ models until core-He exhaustion. The lines and coloured symbols have the same meaning as in Figs. 1 and 2. The 100 M⊙ model inflates on the MS until it reaches the H-bump at log(Teff/K) ∼ 4, after which it loses thermal stability and expands across the H-bump. The growing difference between the surface and nuclear luminosity is magnified in the inset plot.
Current usage metrics show cumulative count of Article Views (full-text article views including HTML views, PDF and ePub downloads, according to the available data) and Abstracts Views on Vision4Press platform.
Data correspond to usage on the plateform after 2015. The current usage metrics is available 48-96 hours after online publication and is updated daily on week days.
Initial download of the metrics may take a while.