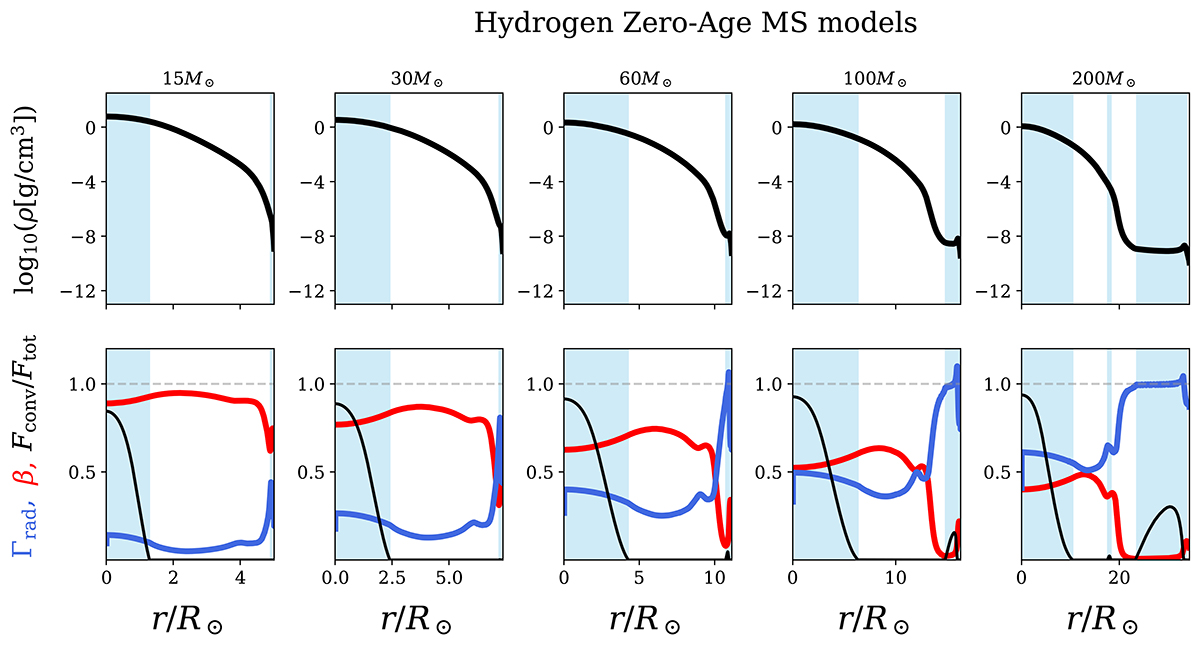
Fig. 6.
Download original image
Stratification of density (top row), local Γrad, gas-to-total pressure ratio β, and convective flux fraction (bottom row) for models on the H-ZAMS. The five columns represent initial masses from 15–200 M⊙. The blue shading indicates convective areas. The plot illustrates the envelope response as Γrad nears the Eddington limit, leading to inflated morphology for the highest masses. All models are in hydrostatic and thermal balance.
Current usage metrics show cumulative count of Article Views (full-text article views including HTML views, PDF and ePub downloads, according to the available data) and Abstracts Views on Vision4Press platform.
Data correspond to usage on the plateform after 2015. The current usage metrics is available 48-96 hours after online publication and is updated daily on week days.
Initial download of the metrics may take a while.