Fig. 4.
Download original image
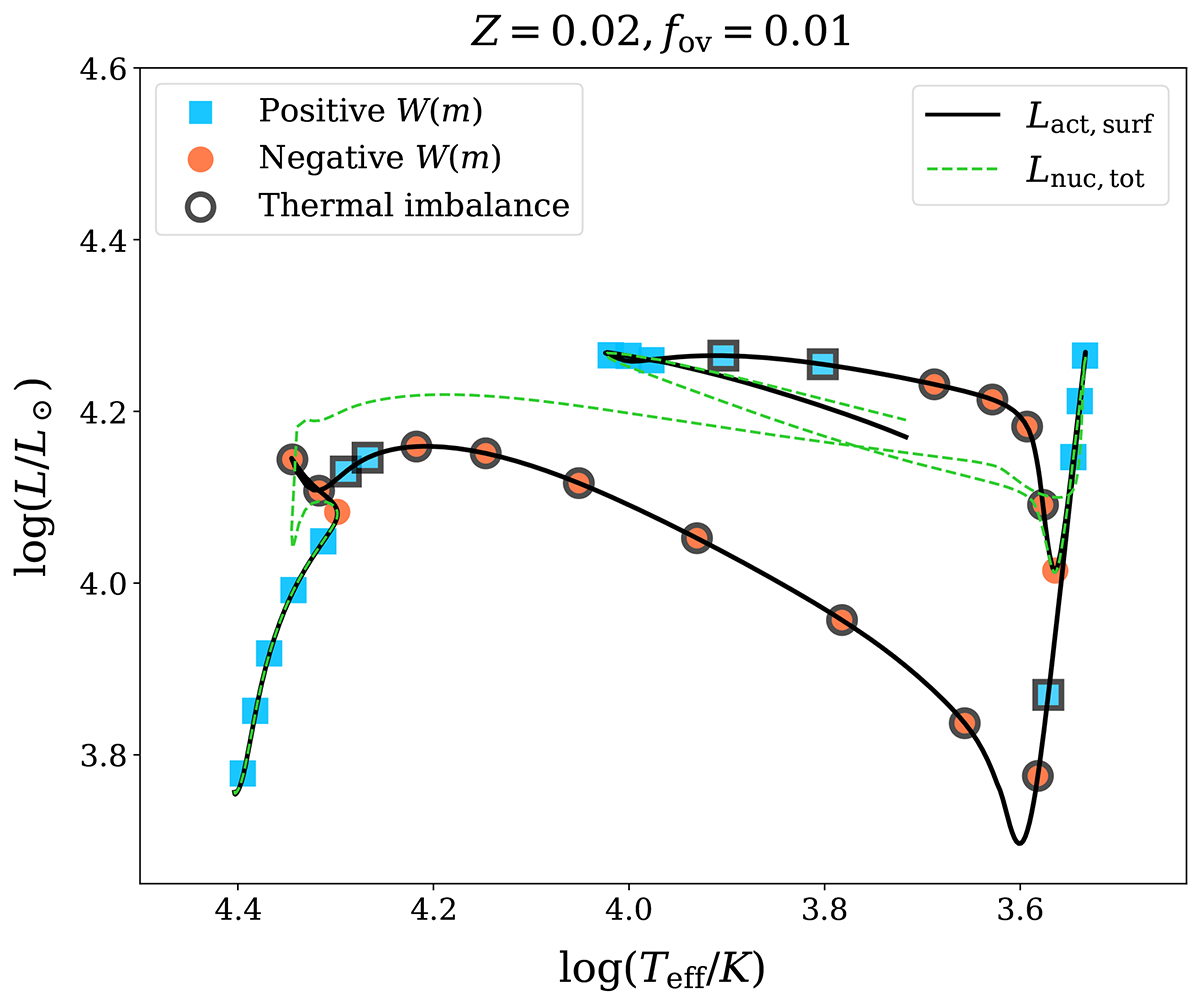
Hertzsprung-Russell diagram of a 10 M⊙ model with low MS core overshooting, illustrating a blue loop contraction episode. The lines and coloured symbols have the same meaning as in Figs. 1 and 2. An additional term Wnuc,m is subtracted to assess stability during the blue loop phase. Roughly three-quarters of the way through core-He burning as an RSG, the model undergoes a blue loop, initially moving away from thermal balance before regaining stability and continuing as a BSG.
Current usage metrics show cumulative count of Article Views (full-text article views including HTML views, PDF and ePub downloads, according to the available data) and Abstracts Views on Vision4Press platform.
Data correspond to usage on the plateform after 2015. The current usage metrics is available 48-96 hours after online publication and is updated daily on week days.
Initial download of the metrics may take a while.