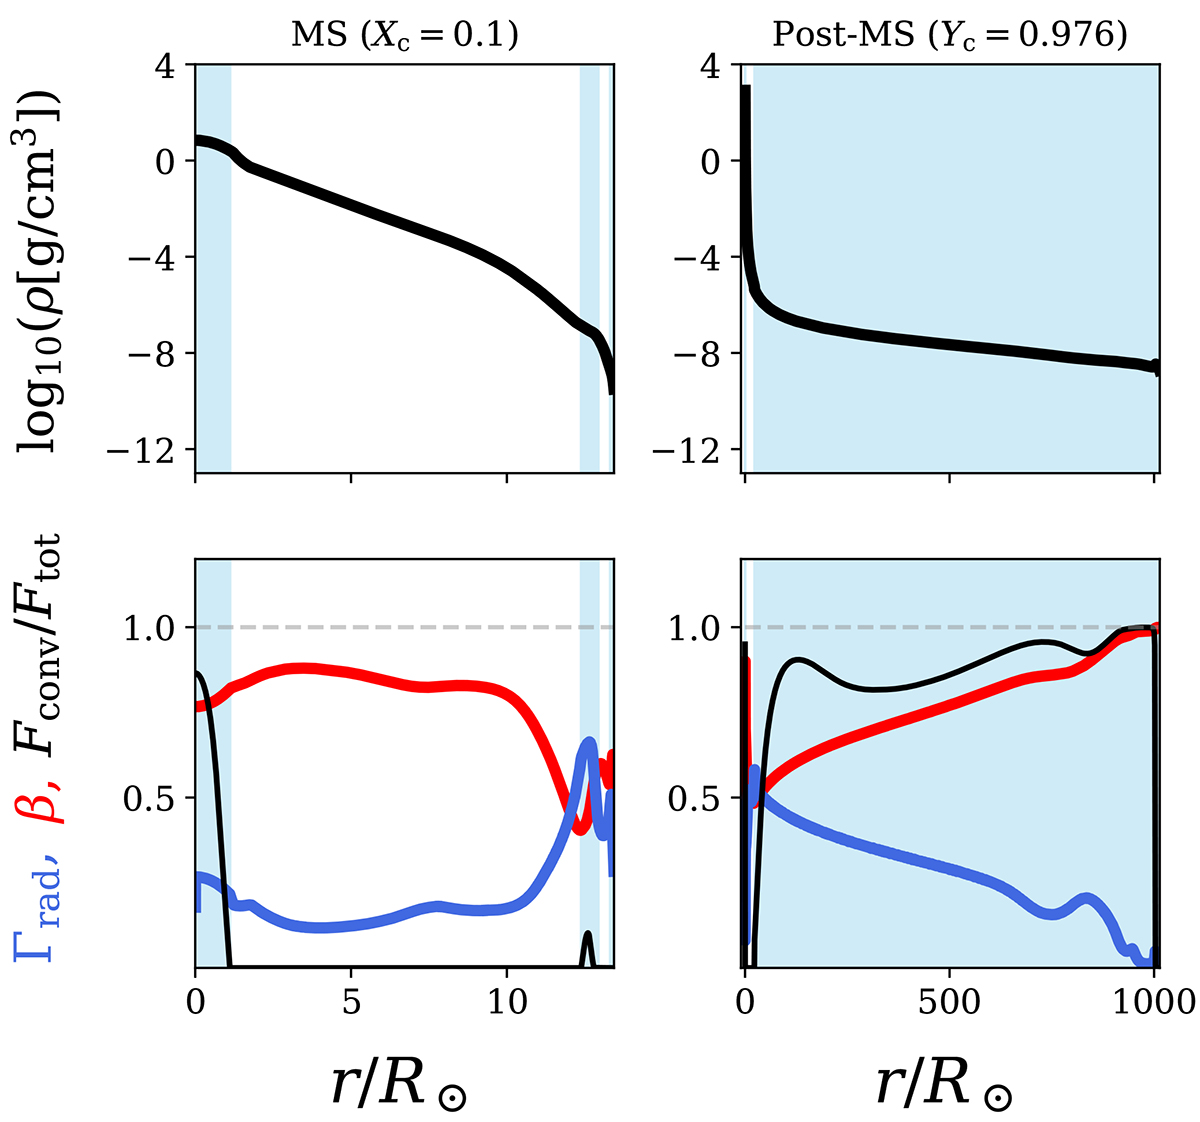
Fig. 3.
Download original image
Internal profiles from the 15 M⊙ model taken near the end of the MS before expansion (left) and at the onset of core-He burning after expansion (right). The profiles show the stratification of density (top panel), local Γrad, gas-to-total pressure ratio β, and convection flux fraction (bottom panel). The blue shaded region indicates convective regions. The post-expansion model exhibits about nine orders of magnitude density contrast between the He-rich core and the envelope.
Current usage metrics show cumulative count of Article Views (full-text article views including HTML views, PDF and ePub downloads, according to the available data) and Abstracts Views on Vision4Press platform.
Data correspond to usage on the plateform after 2015. The current usage metrics is available 48-96 hours after online publication and is updated daily on week days.
Initial download of the metrics may take a while.