Fig. 2.
Download original image
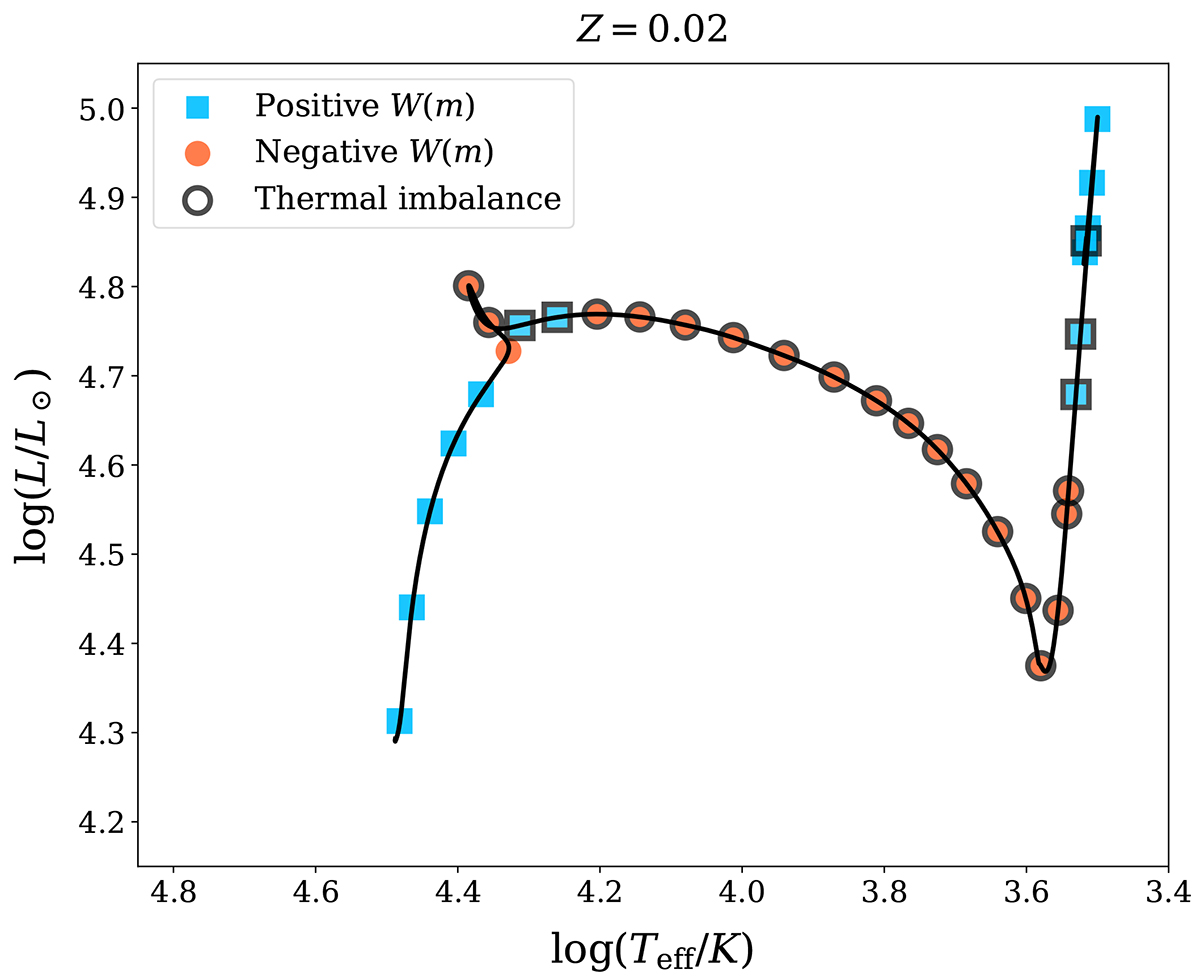
Hertzsprung-Russell diagram track of the 15 M⊙ model in Fig. 1, but over-plotted with coloured symbols based on the value of Wm in the envelope. Blue squares if positive Wm, reflecting the envelope’s ability to regain thermal balance, while red circles if negative Wm, indicating an unstable scenario. Symbols are highlighted with a thick black border if the deviation from thermal balance exceeds 1% between actual and nuclear luminosity.
Current usage metrics show cumulative count of Article Views (full-text article views including HTML views, PDF and ePub downloads, according to the available data) and Abstracts Views on Vision4Press platform.
Data correspond to usage on the plateform after 2015. The current usage metrics is available 48-96 hours after online publication and is updated daily on week days.
Initial download of the metrics may take a while.