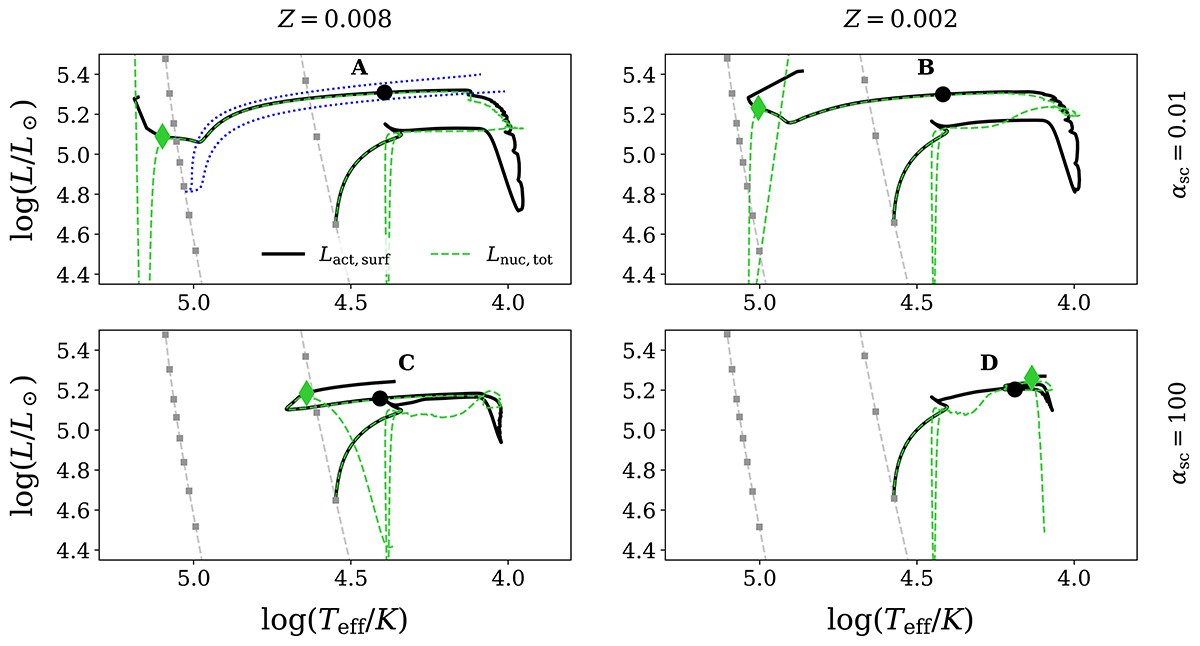
Fig. 13.
Download original image
Left: Binary evolution tracks of a 20 M⊙ primary star at Z = 0.008 and right: at Z = 0.002 undergoing thermal mass transfer during the expansion phase. The two rows correspond to different value of semi-convection parameter used (αsc = 0.01 and 100). The colours of the binary tracks have the same meaning as in Fig. 1. The green diamonds mark end of core-He burning. The two grey dashed lines are the H- and He-ZAMS with different initial masses marked as grey squares. Black circles (A–D) are marked where the models regain thermal balance after the MT phase. The two blue dotted curves show loci of structure models with increasing H envelope mass on top of a 7 M⊙ pure-He core, corresponding to the different mass fraction of H added: X = 0.1, 0.2. These structure models are over-luminous compared to their He-ZAMS counterparts of the same mass, and illustrate the inflated nature of models with a low-mass, H-poor envelope above a He-burning core.
Current usage metrics show cumulative count of Article Views (full-text article views including HTML views, PDF and ePub downloads, according to the available data) and Abstracts Views on Vision4Press platform.
Data correspond to usage on the plateform after 2015. The current usage metrics is available 48-96 hours after online publication and is updated daily on week days.
Initial download of the metrics may take a while.