Fig. 6
Download original image
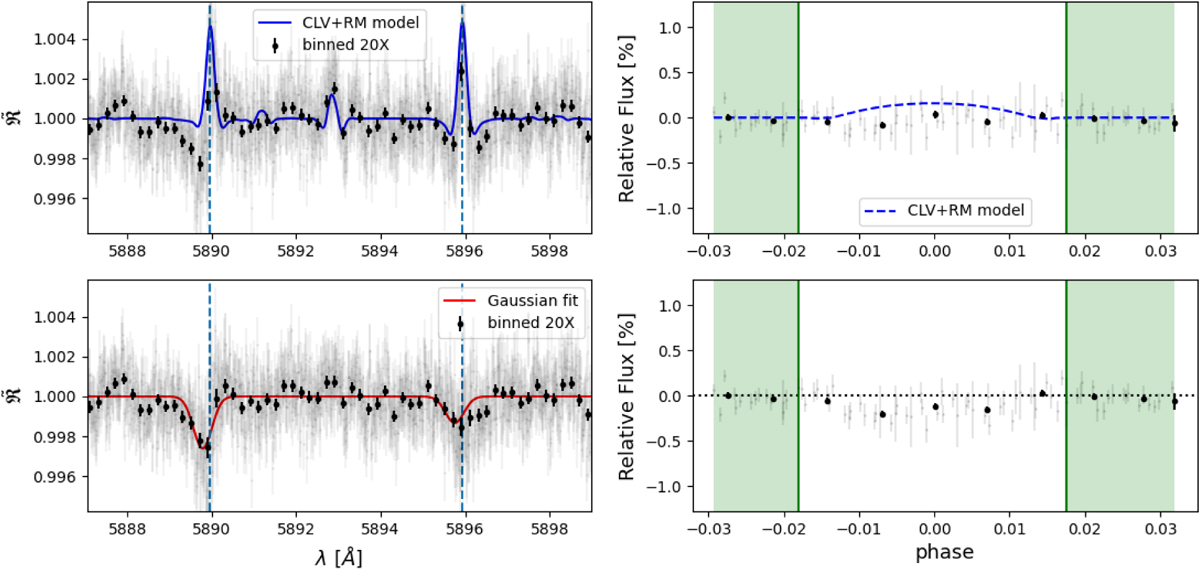
Final transmission spectrum (left) and relative TLC (right) of HD 209458 b without the correction of the CLV and RM effects (upper panels) and after their correction (bottom panel). The blue line is the best-fit CLV+RM model; the red line is the MCMC Gaussian fit. The plots refer to the results obtained after excluding HD2-N1, HD2-N2, HD2-N3, HD2-N4, and HD2-N6.
Current usage metrics show cumulative count of Article Views (full-text article views including HTML views, PDF and ePub downloads, according to the available data) and Abstracts Views on Vision4Press platform.
Data correspond to usage on the plateform after 2015. The current usage metrics is available 48-96 hours after online publication and is updated daily on week days.
Initial download of the metrics may take a while.