Open Access
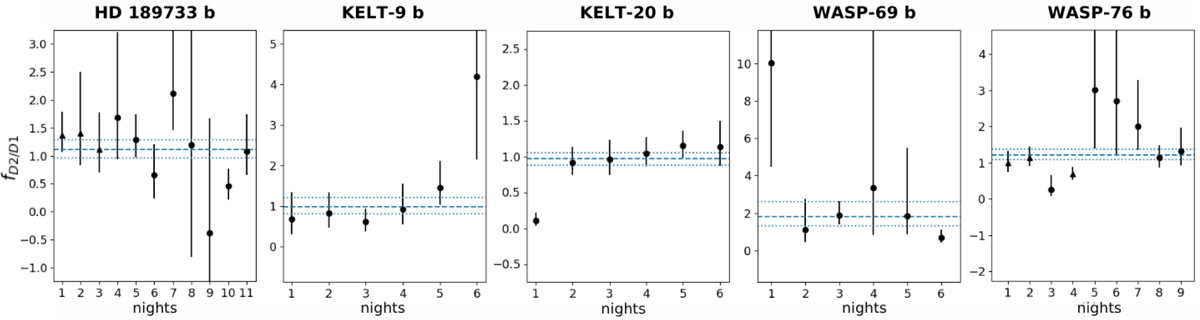
Fig. 5
Download original image
Variability of the line depth ratio for each target with detection. The average value and its 1σ errors obtained by combining all nights are indicated by the horizontal dashed and dotted lines, respectively.
Current usage metrics show cumulative count of Article Views (full-text article views including HTML views, PDF and ePub downloads, according to the available data) and Abstracts Views on Vision4Press platform.
Data correspond to usage on the plateform after 2015. The current usage metrics is available 48-96 hours after online publication and is updated daily on week days.
Initial download of the metrics may take a while.