Fig. 4
Download original image
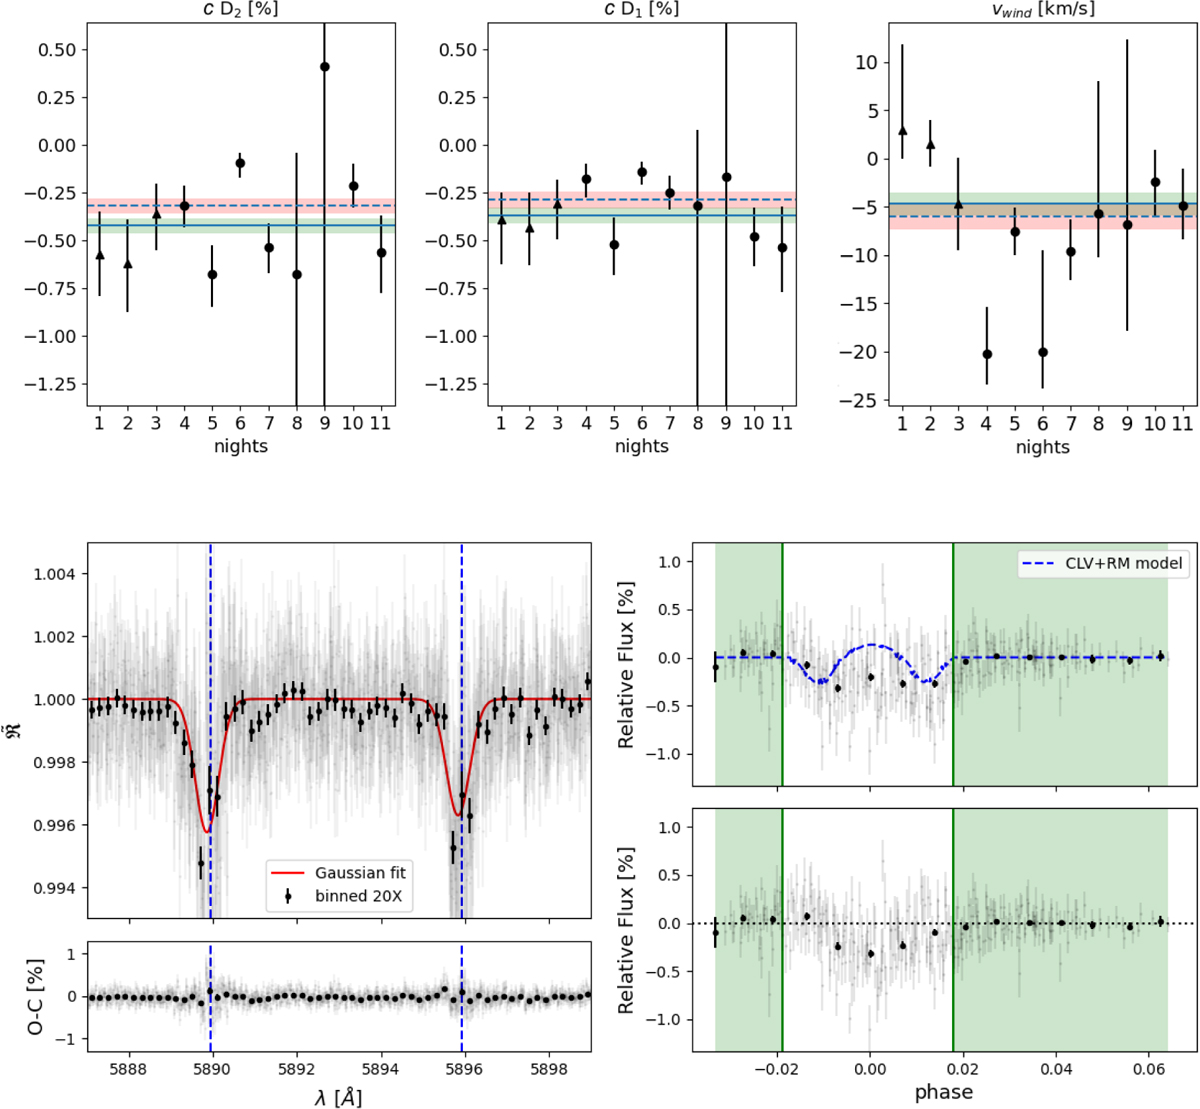
Results obtained for HD 189733 b. Upper panels: contrasts of Na D2 and D1 lines (first and second panel) and wind measurements (third panel) for each night. Data points marked with triangles correspond to HARPS nights, circles to HARPS-N nights. The value obtained combining all nights is indicated by a horizontal dashed line, while its 1σ errors mark the confidence interval, which is indicated with a red band. The horizontal solid line inside the green band indicates the average value obtained after the exclusion of the nights with larger uncertainties or very small contrast (see the text). Bottom panels: final transmission spectrum centred around the Na I D (light grey), also binned by 20x in black circles (left) and the relative TLC, before and after the correction of the CLV and RM effects (right). The red line is the MCMC Gaussian fit, while the vertical dashed blue lines indicate the rest frame transition wavelengths of the sodium doublet. The green background marks the exposures taken out-of-transit. The results are referred to the average spectrum after excluding HD1-N6, HD1-N8 and HD1-N9.
Current usage metrics show cumulative count of Article Views (full-text article views including HTML views, PDF and ePub downloads, according to the available data) and Abstracts Views on Vision4Press platform.
Data correspond to usage on the plateform after 2015. The current usage metrics is available 48-96 hours after online publication and is updated daily on week days.
Initial download of the metrics may take a while.