Open Access
Fig. 9.
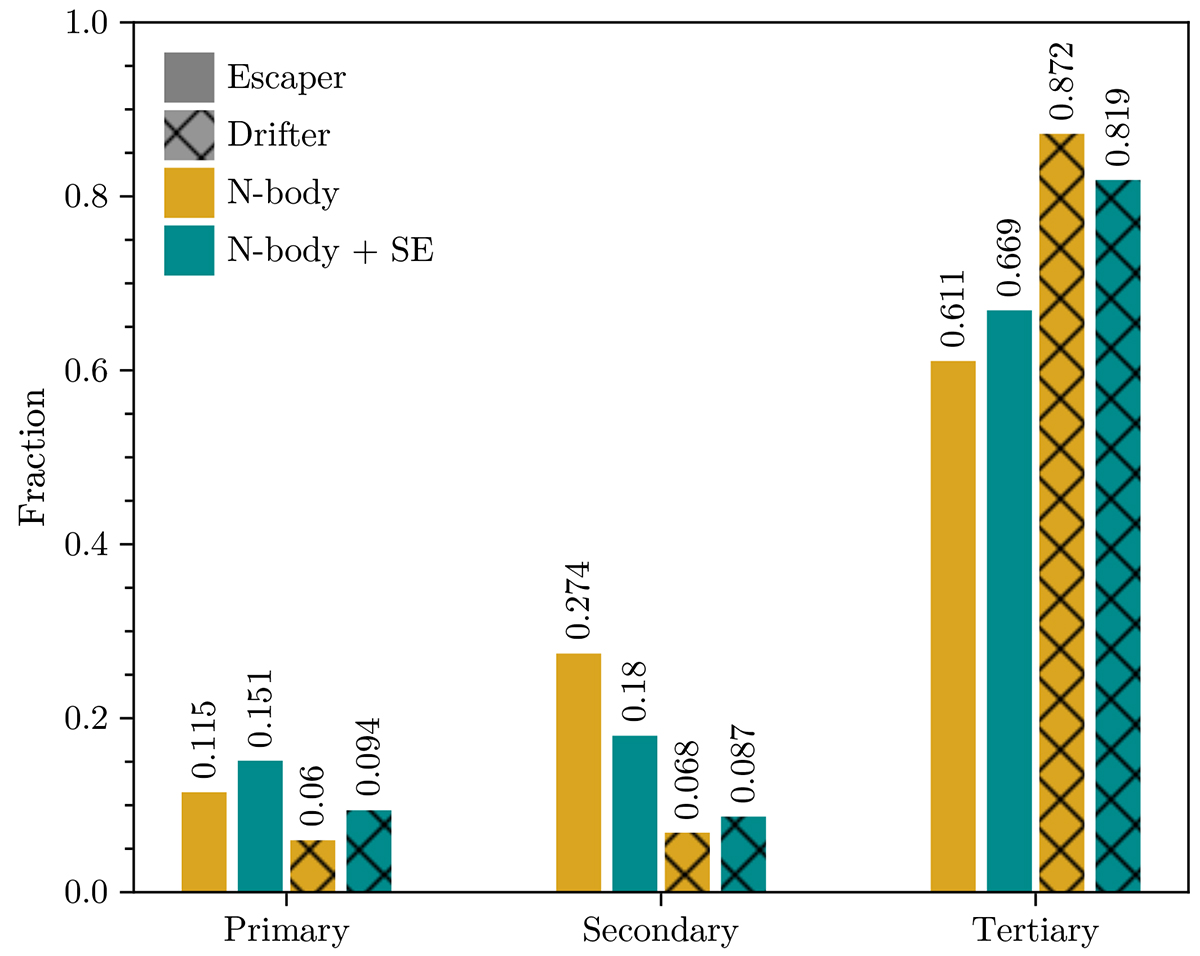
Download original image
Bar chart showing which fraction of escaped stars were the primary, secondary, or tertiary in their original configuration. The solid and patterned bars indicate the distributions for escapers and drifters respectively, with the colours indicating the two different models.
Current usage metrics show cumulative count of Article Views (full-text article views including HTML views, PDF and ePub downloads, according to the available data) and Abstracts Views on Vision4Press platform.
Data correspond to usage on the plateform after 2015. The current usage metrics is available 48-96 hours after online publication and is updated daily on week days.
Initial download of the metrics may take a while.