Open Access
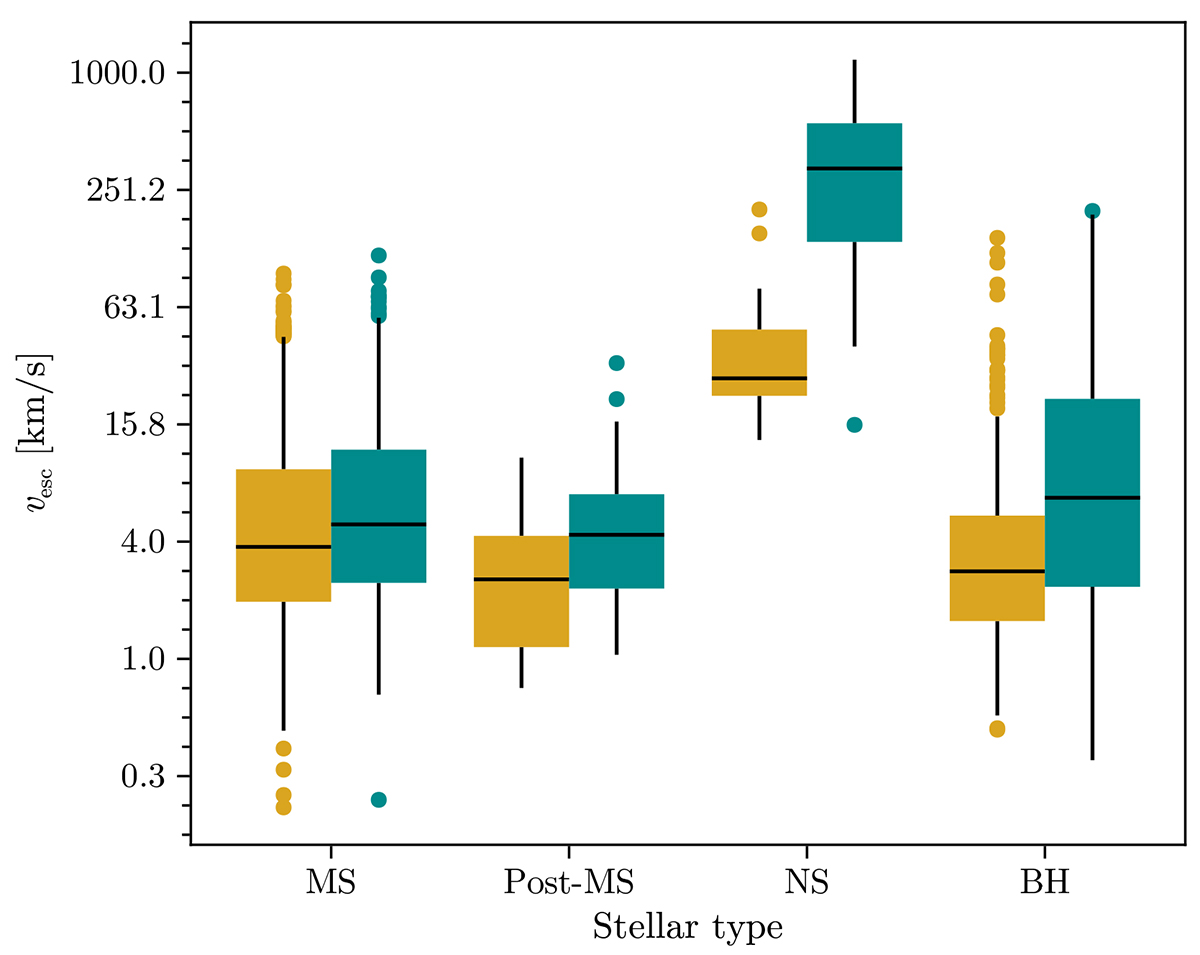
Fig. 8.
Download original image
Distributions of the velocities of the ejected components as a function of stellar type. The crossbar marks the median value of each distribution, with the whiskers indicating the 1 interquartile range. The markers show the outliers laying outside the whiskers.
Current usage metrics show cumulative count of Article Views (full-text article views including HTML views, PDF and ePub downloads, according to the available data) and Abstracts Views on Vision4Press platform.
Data correspond to usage on the plateform after 2015. The current usage metrics is available 48-96 hours after online publication and is updated daily on week days.
Initial download of the metrics may take a while.