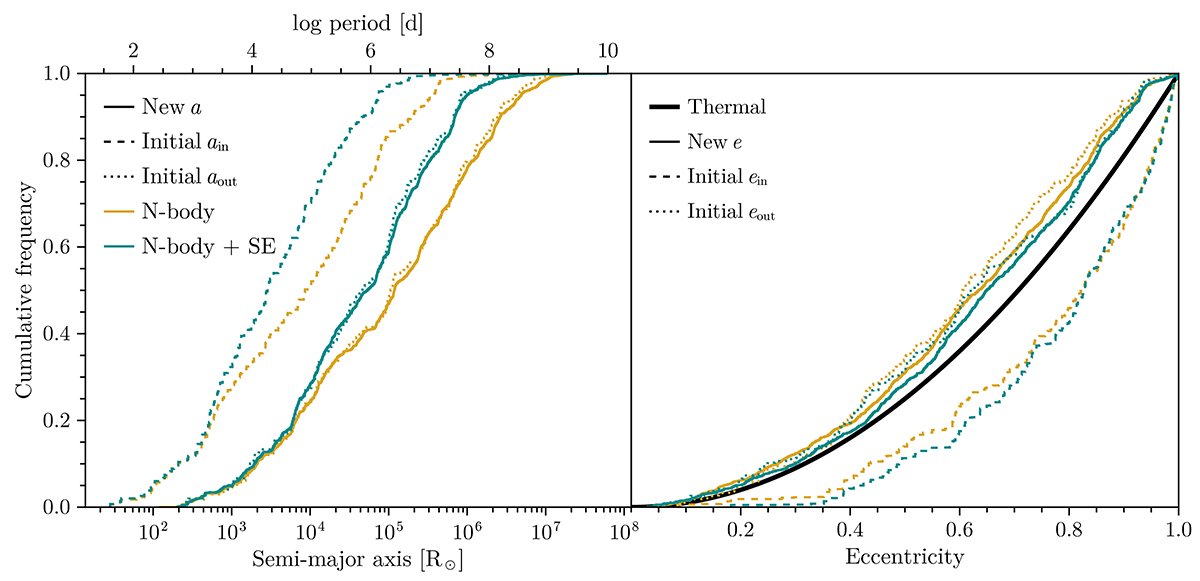
Fig. 5.
Download original image
Properties of the newly formed binaries following the collision between two bodies in the original triple. The left figure shows the cumulative distribution of the semi-major axis, while the right shows the eccentricity. The dotted and dashed lines represent the semi-major axes and eccentricities at the onset of instability.
Current usage metrics show cumulative count of Article Views (full-text article views including HTML views, PDF and ePub downloads, according to the available data) and Abstracts Views on Vision4Press platform.
Data correspond to usage on the plateform after 2015. The current usage metrics is available 48-96 hours after online publication and is updated daily on week days.
Initial download of the metrics may take a while.