Fig. 9.
Download original image
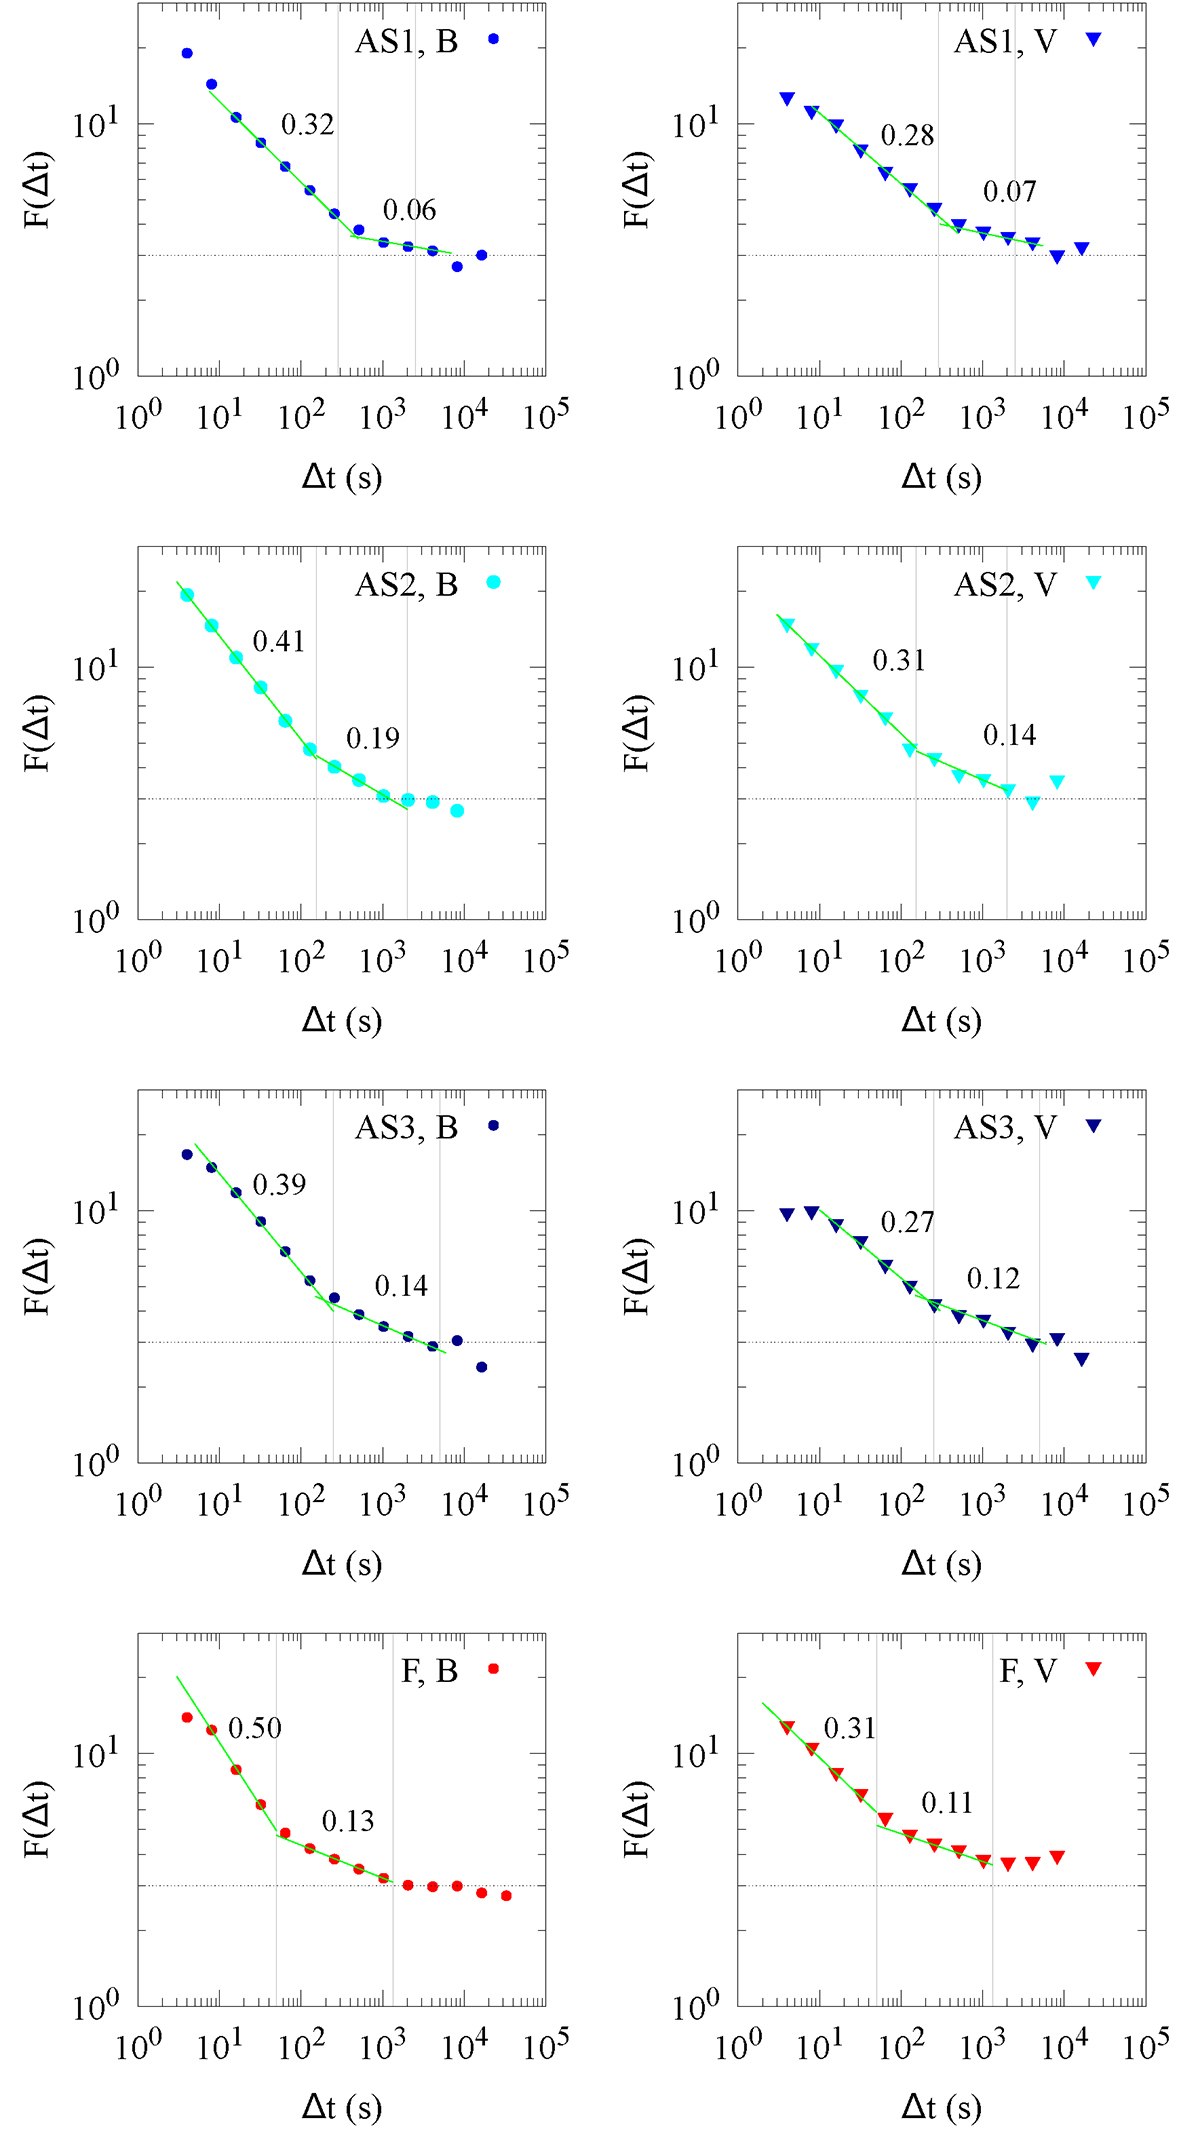
Flatness of magnetic field (left) and velocity (right), averaged over the three vector components. Vertical lines mark the frequency breaks observed in the spectra. The scaling exponents κ are indicated where a power-law fit was performed (green lines, extended beyond the fitting range to better identify the break scales). The horizontal lines indicate the Gaussian value F = 3. Color code as in Figure 6.
Current usage metrics show cumulative count of Article Views (full-text article views including HTML views, PDF and ePub downloads, according to the available data) and Abstracts Views on Vision4Press platform.
Data correspond to usage on the plateform after 2015. The current usage metrics is available 48-96 hours after online publication and is updated daily on week days.
Initial download of the metrics may take a while.