Fig. 6.
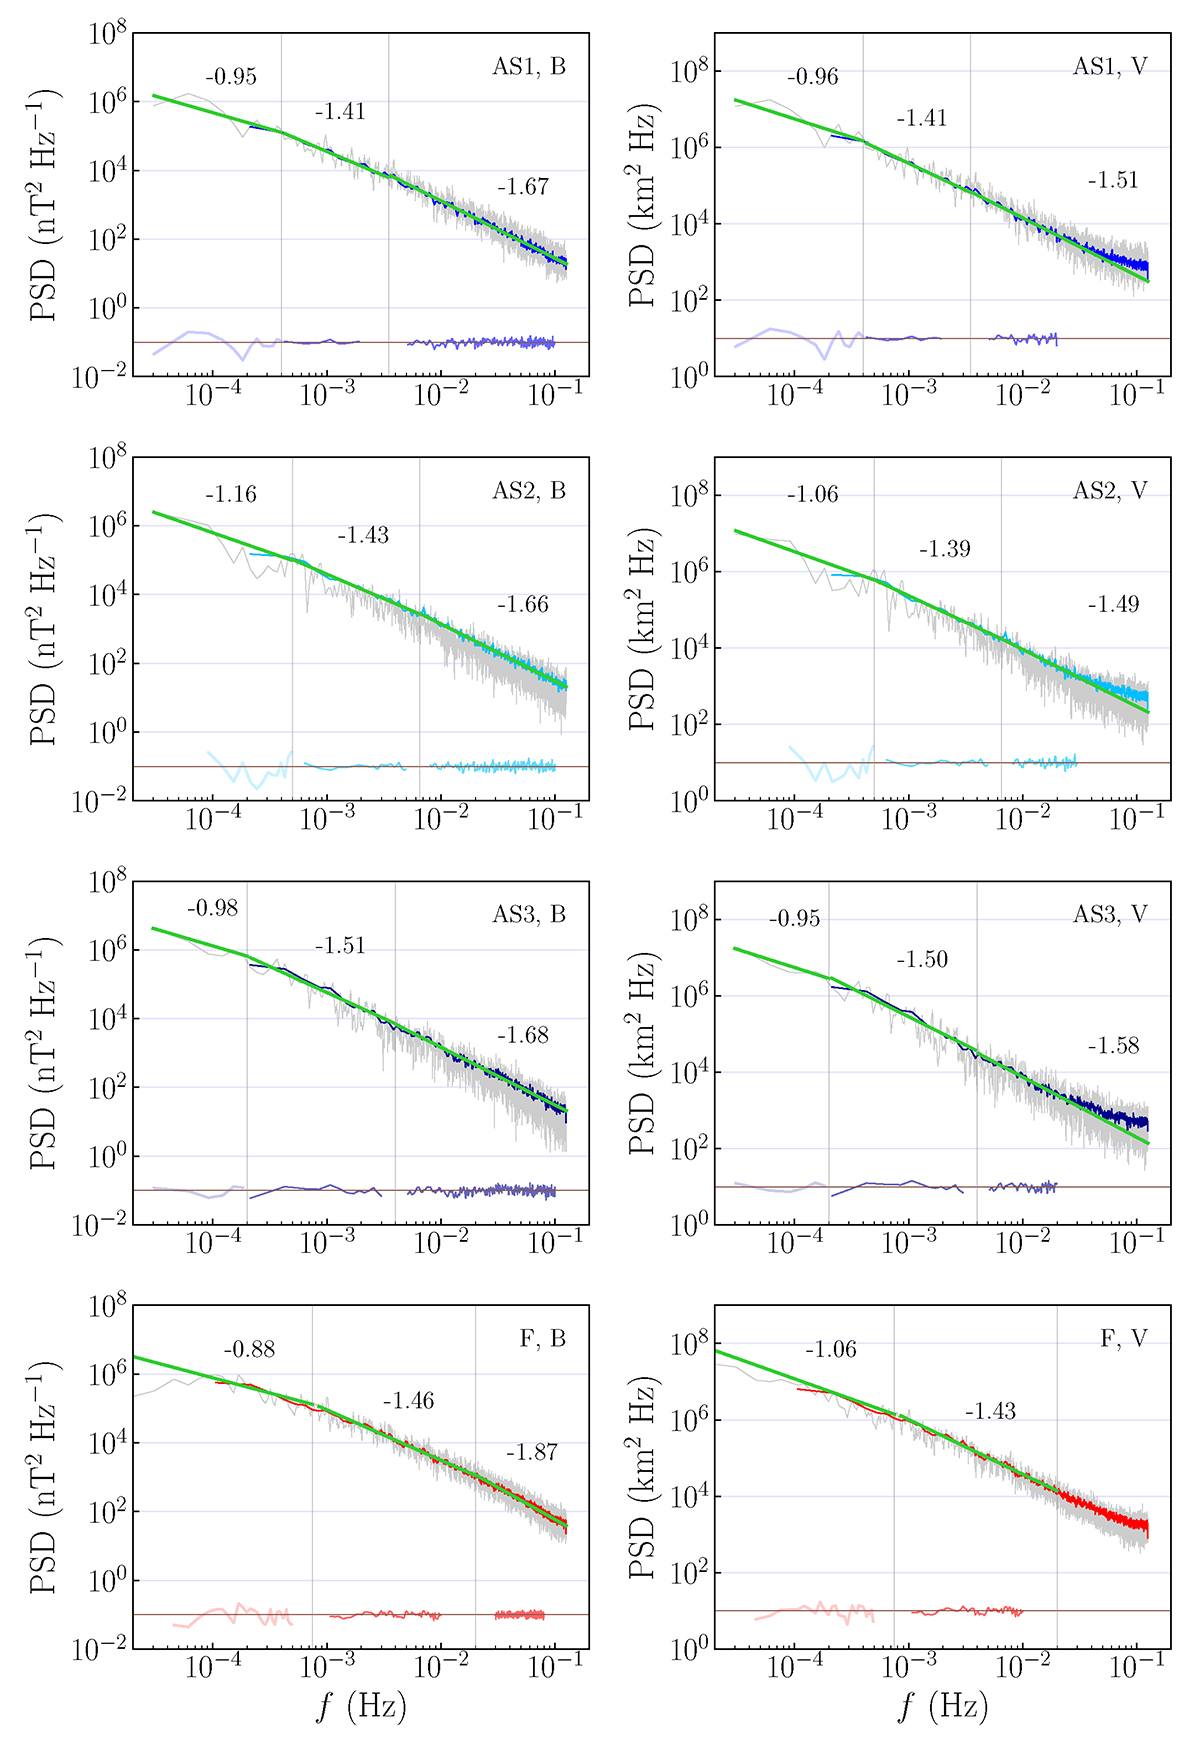
Download original image
Power spectral density of the trace of magnetic field and solar wind velocity, left and right panels respectively, for AS1 (blue), AS2 (cyan), AS3 (dark blue), and F (red) data intervals. The PSDs are shown in gray (without smoothing) and colors (Welch method). Green solid lines indicate the PSD best fit along with their scaling exponent. Vertical lines mark the different frequency ranges where PSD fit are performed, corresponding to possible spectral breaks identified from PSD traces of the magnetic field. Colored lines in the bottom of each panel indicate the piecewise compensated spectra for each sector. High-frequency regions where velocity PSDs flatten due to instrumental noise are excluded from the fit.
Current usage metrics show cumulative count of Article Views (full-text article views including HTML views, PDF and ePub downloads, according to the available data) and Abstracts Views on Vision4Press platform.
Data correspond to usage on the plateform after 2015. The current usage metrics is available 48-96 hours after online publication and is updated daily on week days.
Initial download of the metrics may take a while.