Fig. 5.
Download original image
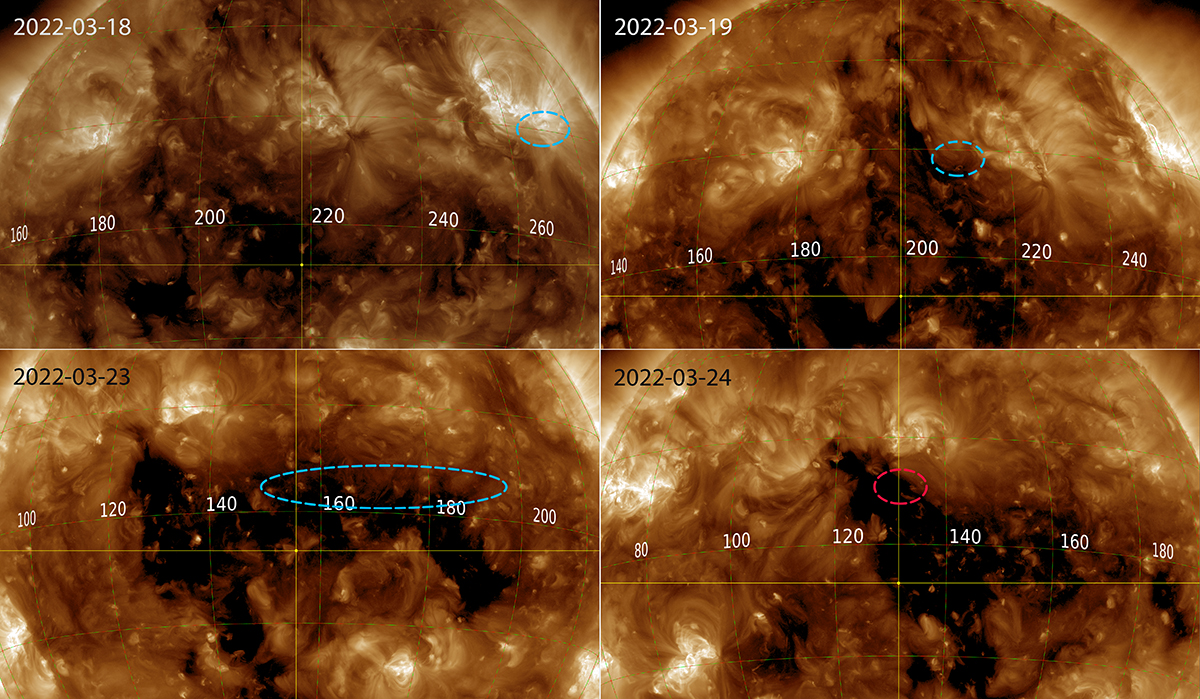
Images from SDO/AIA of the 193 Å band showing the corona and source regions of the different solar wind streams described in the paper. Top left, AS1, top right AS2, bottom left AS3, bottom right F. The image dates, reported in the panels, were chosen to best display the source region on the Sun. Dashed regions are the projection of the s/c location down to the solar wind source region.
Current usage metrics show cumulative count of Article Views (full-text article views including HTML views, PDF and ePub downloads, according to the available data) and Abstracts Views on Vision4Press platform.
Data correspond to usage on the plateform after 2015. The current usage metrics is available 48-96 hours after online publication and is updated daily on week days.
Initial download of the metrics may take a while.