Fig. 3.
Download original image
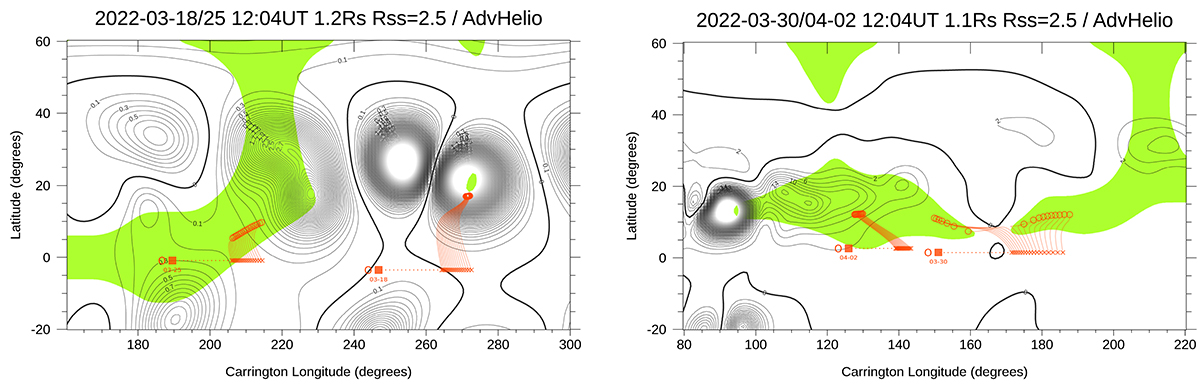
Potential field source surface B2 contour maps and solar wind magnetic foot-points along Solar Orbiter trajectories (red) for the selected intervals. The projection of the s/c location (squares) on the source surface (crosses) and down to the solar wind source region (circles). The maps are magnetic pressure iso-contours calculated for the heights R = 1.2 R⊙ and R = 1.1 R⊙ (chosen to make the magnetic field contours clearer). The crosses result from ballistic mapping using the measured in situ solar wind speed ±80 km/s in bins of 10 km/s. Open magnetic field regions are shown in green (positive polarity) while the neutral line is in black bold.
Current usage metrics show cumulative count of Article Views (full-text article views including HTML views, PDF and ePub downloads, according to the available data) and Abstracts Views on Vision4Press platform.
Data correspond to usage on the plateform after 2015. The current usage metrics is available 48-96 hours after online publication and is updated daily on week days.
Initial download of the metrics may take a while.