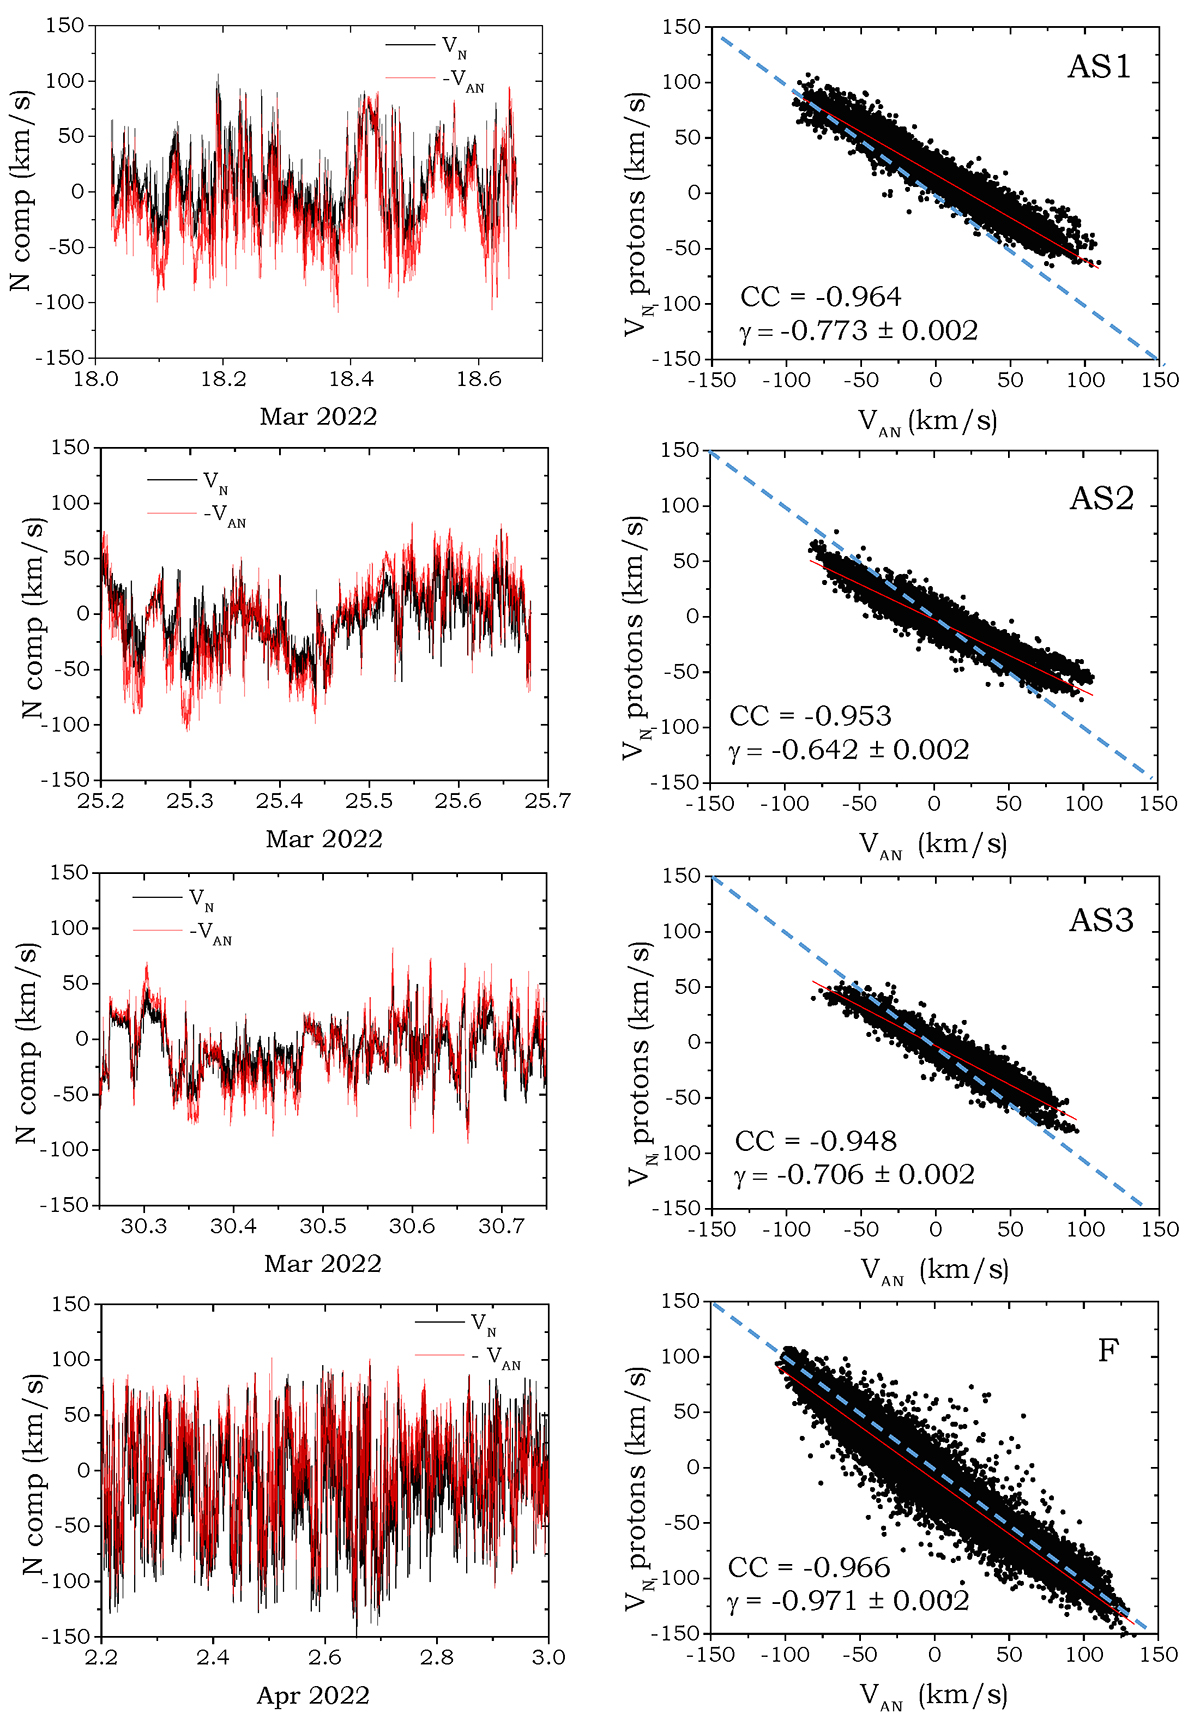
Fig. 2.
Download original image
Time series of the N components of velocity, VN (black line), and magnetic field (in Alfvén units), −VAN (red line), for the different Alfvénic streams (left panels), highlighting the v − b correlations and corresponding to L2 PAS data. For the same streams, the scatter plots of the same components are displayed in the right panels, along with the Pearson correlation coefficients, CC and slopes, γ, of the linear fits (solid red lines). Derived Alfvén ratios, rA, are the following: 0.60, 0.41, 0.50, 0.93, moving from upper to lower panel. The ideal slope equal to −1, indicating equipartition of energy, is shown as a blue dashed line. Explanation in the text on how rA is related to γ.
Current usage metrics show cumulative count of Article Views (full-text article views including HTML views, PDF and ePub downloads, according to the available data) and Abstracts Views on Vision4Press platform.
Data correspond to usage on the plateform after 2015. The current usage metrics is available 48-96 hours after online publication and is updated daily on week days.
Initial download of the metrics may take a while.