Open Access
Fig. 12.
Download original image
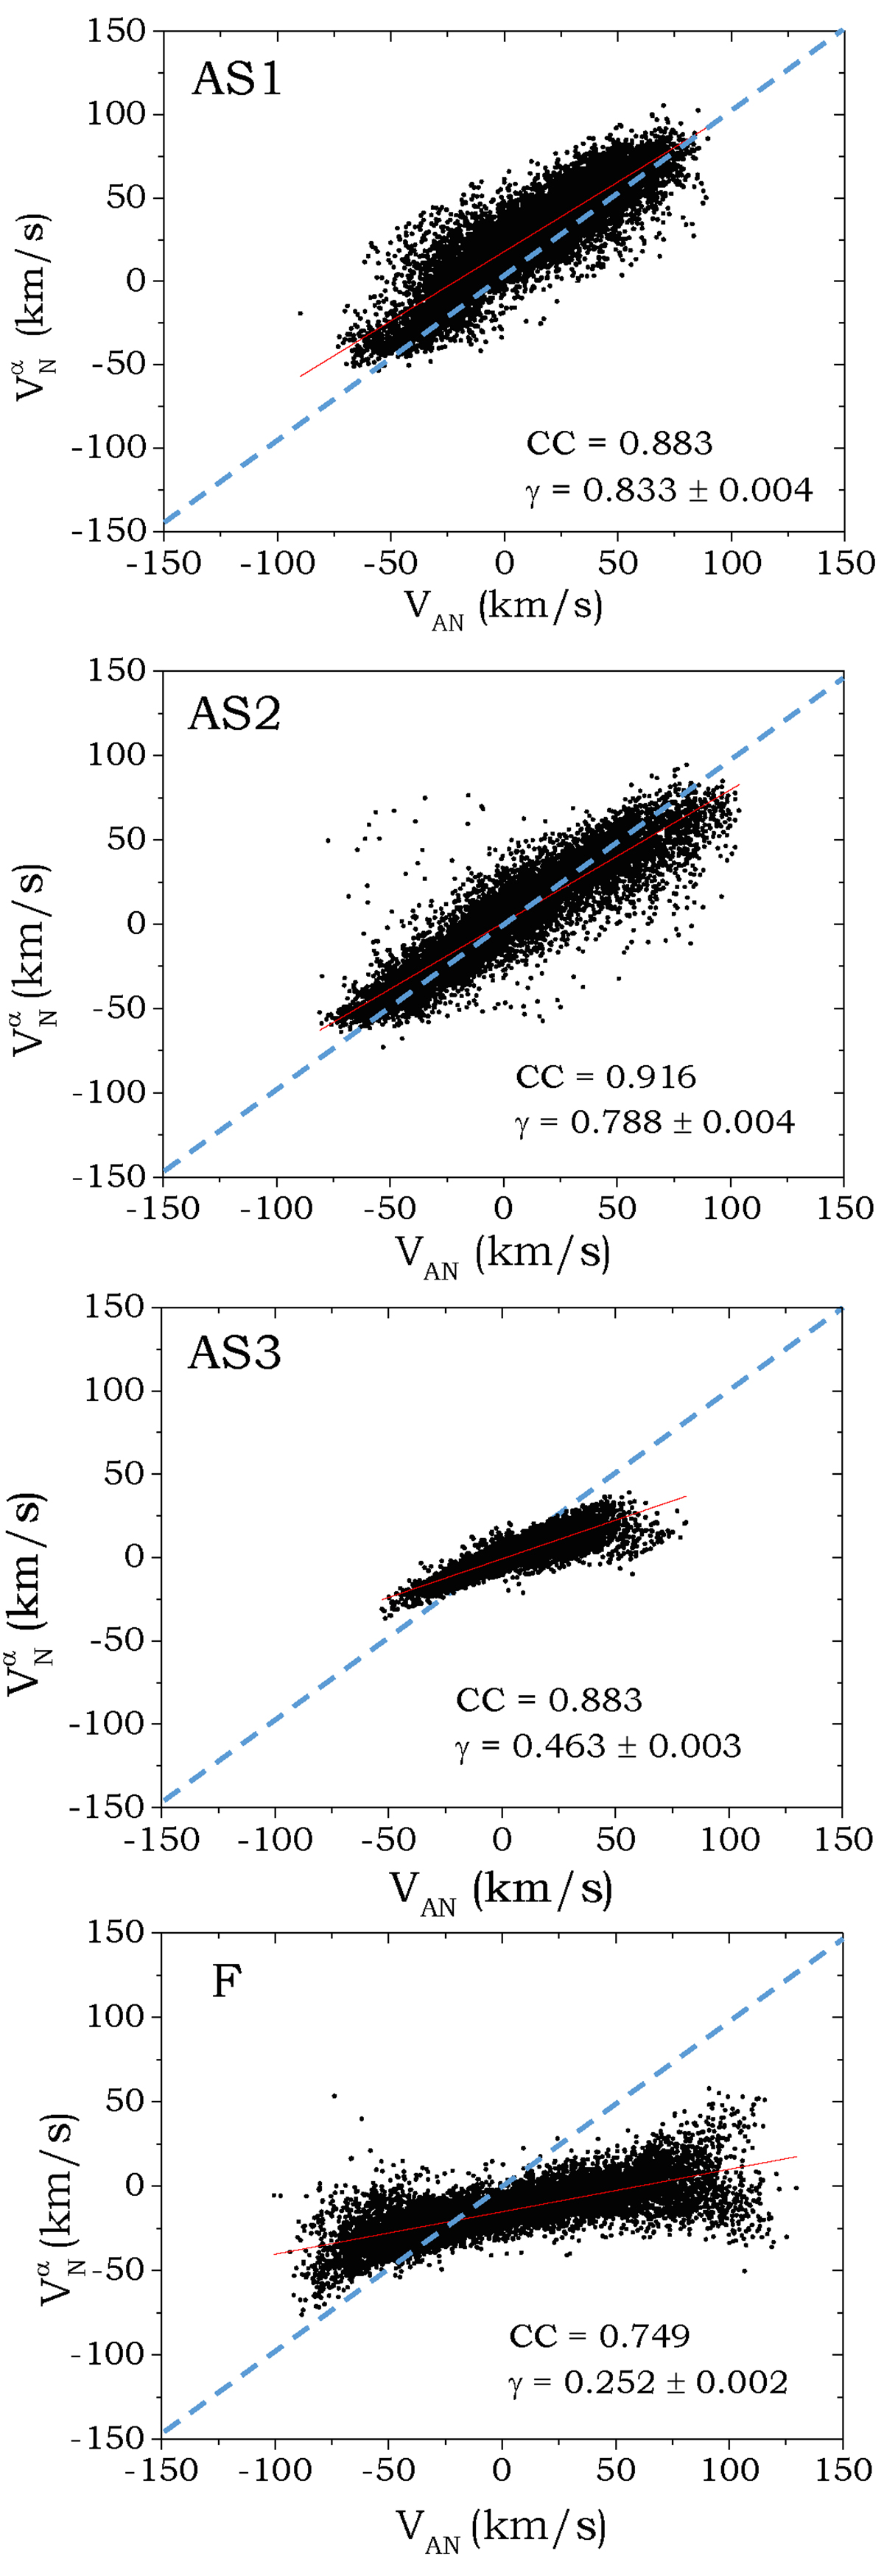
Scatter plots of the normal components of velocity of alpha particles, ![]() , and magnetic field, VAN, in Alfvén units. The Pearson correlation coefficient, CC, along with the slope of the fit, γ, represented by the solid red line, is shown in each panel. The blue dashed lines corresponds to
, and magnetic field, VAN, in Alfvén units. The Pearson correlation coefficient, CC, along with the slope of the fit, γ, represented by the solid red line, is shown in each panel. The blue dashed lines corresponds to ![]() .
.
Current usage metrics show cumulative count of Article Views (full-text article views including HTML views, PDF and ePub downloads, according to the available data) and Abstracts Views on Vision4Press platform.
Data correspond to usage on the plateform after 2015. The current usage metrics is available 48-96 hours after online publication and is updated daily on week days.
Initial download of the metrics may take a while.