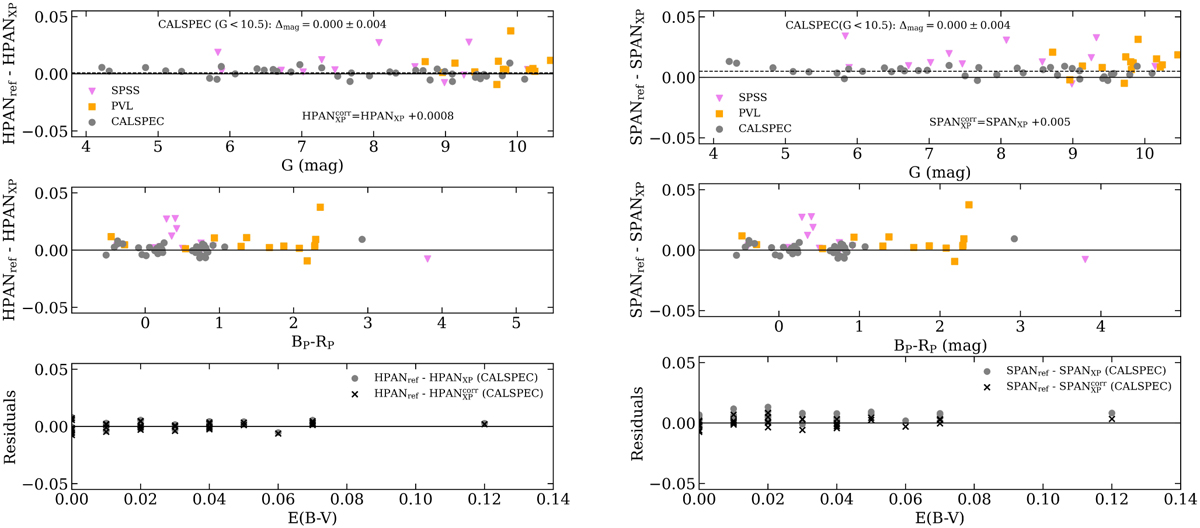
Fig. A.1
Download original image
Difference between synthetic magnitudes from the reference spectra and synthetic magnitudes from the XP spectra as a function of G magnitude (upper panels) and Bp−Rp colours (middle panels) for SIMBIO-SYS HRIC_PAN e STC_PAN. The thick horizontal line marks Δmag = 0.0. Points are colour-coded after the reference set they belong to, pink=SPSS, grey=CALSPEC, yellow=PVL. The mean and standard deviation of the magnitude difference after applying the correction (formula reported on the plot), for the 37 CALSPEC stars having G<10.5 mag, is reported in the top-right corner of upper panels. The correction is plotted in the upper panel if it is a correction as a function of G and in the middle panel if it is a correction as a function of Bp − Rp. The residuals before and after (i.e., difference between synthetic magnitudes from the reference spectra and corrected synthetic magnitudes from the XP spectra) the correction for CALSPEC stars are plotted as a function of extinction E(B-V) in the bottom panel with grey markers and black crosses, respectively. We adopted the E(B-V) values provided by the CALSPEC collaboration (https://www.stsci.edu/hst/instrumentation/reference-data-for-calibration-and-tools/astronomical-catalogs/calspec, data retrieved on September 5, 2024 (Bohlin et al. 2020)).
Current usage metrics show cumulative count of Article Views (full-text article views including HTML views, PDF and ePub downloads, according to the available data) and Abstracts Views on Vision4Press platform.
Data correspond to usage on the plateform after 2015. The current usage metrics is available 48-96 hours after online publication and is updated daily on week days.
Initial download of the metrics may take a while.