Fig. A.3
Download original image
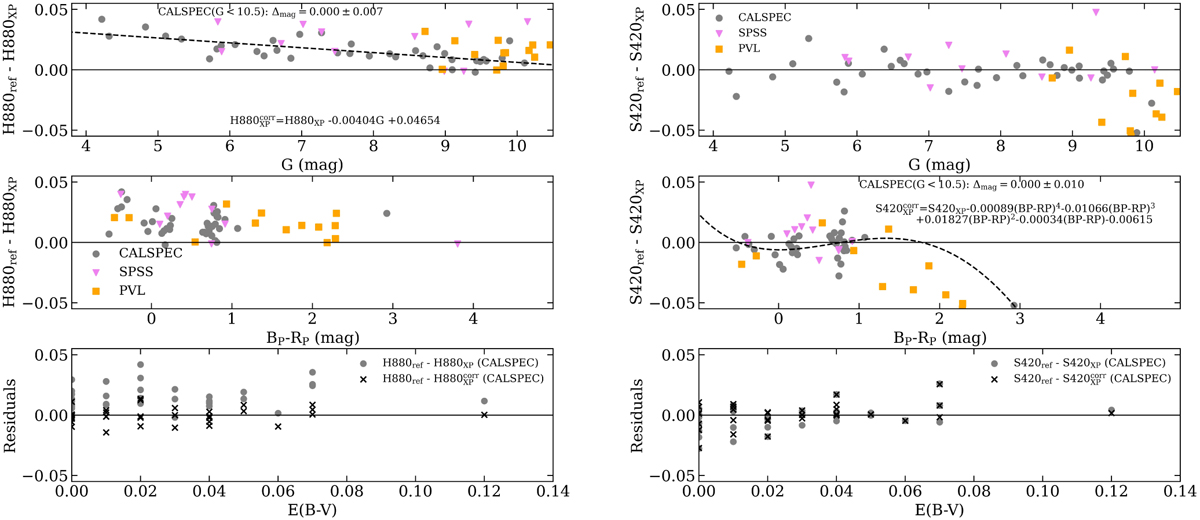
The same as Fig. (A.1) for HRIC_F880 and STC_F420. The dashed black line in the upper left panel is the polynomial of the correction as a function of G for HRIC_F880, fitted to CALSPEC stars with G < 10.5. The black dashed curves are curve in the middle right panel is the polynomial of the correction as a function of Bp−Rp for STC_F420, fitted to CALSPEC stars with G < 10.5 mag.
Current usage metrics show cumulative count of Article Views (full-text article views including HTML views, PDF and ePub downloads, according to the available data) and Abstracts Views on Vision4Press platform.
Data correspond to usage on the plateform after 2015. The current usage metrics is available 48-96 hours after online publication and is updated daily on week days.
Initial download of the metrics may take a while.