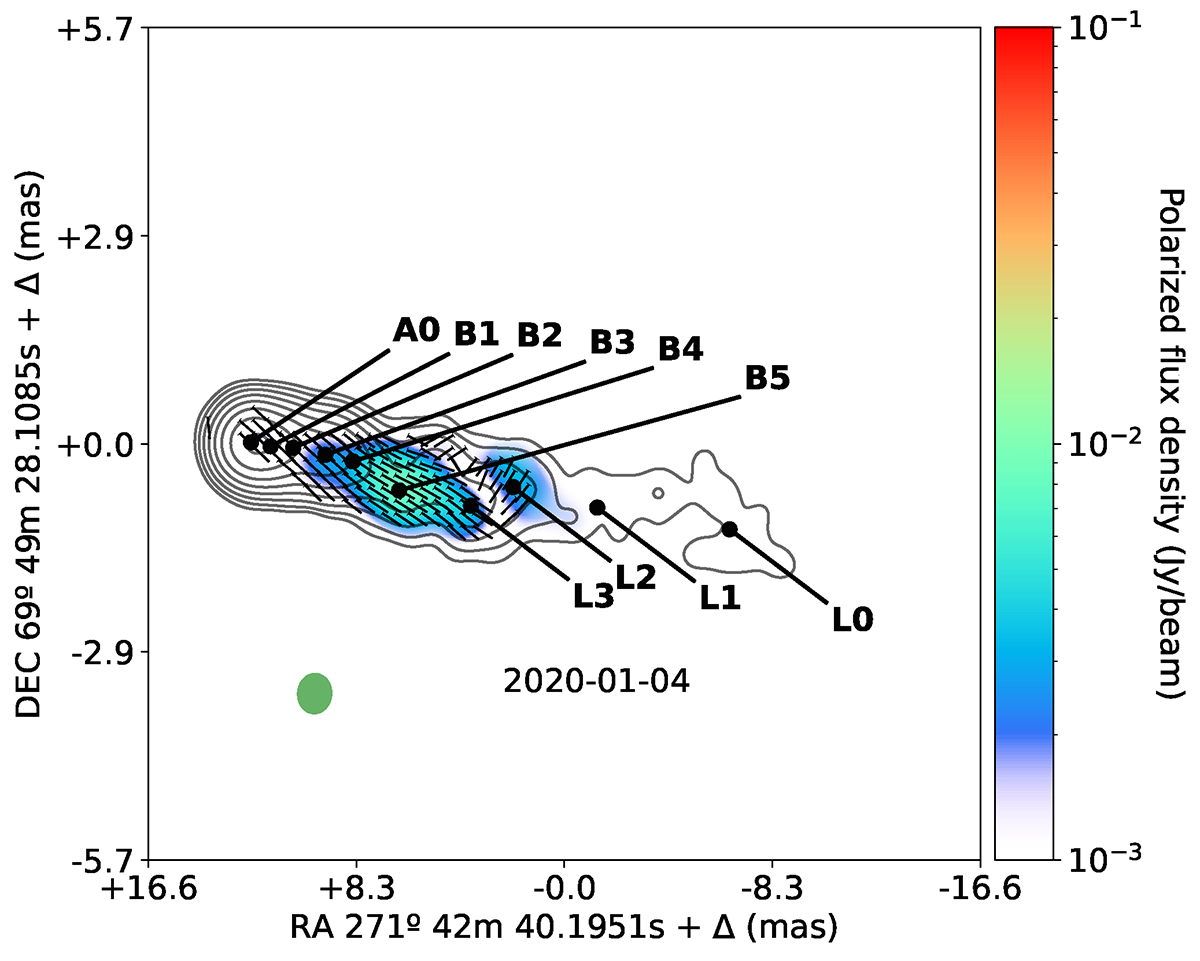
Fig. 8.
Download original image
Epoch 2020 Jan. 4 VLBI 2 cm image of 3C 371, showing the total flux density (black contours) and the polarised flux density (colour scale). Black line segments overlaid in the image represent the EVPA orientation. The innermost and outermost contours correspond to flux density levels of 5.5 and 0.0015 Jy, with the rest of the contours logarithmically equispaced. The green ellipse represents the beam size. The image highlights the core A0 and all identified components B1–L0.
Current usage metrics show cumulative count of Article Views (full-text article views including HTML views, PDF and ePub downloads, according to the available data) and Abstracts Views on Vision4Press platform.
Data correspond to usage on the plateform after 2015. The current usage metrics is available 48-96 hours after online publication and is updated daily on week days.
Initial download of the metrics may take a while.