Open Access
Fig. 3.
Download original image
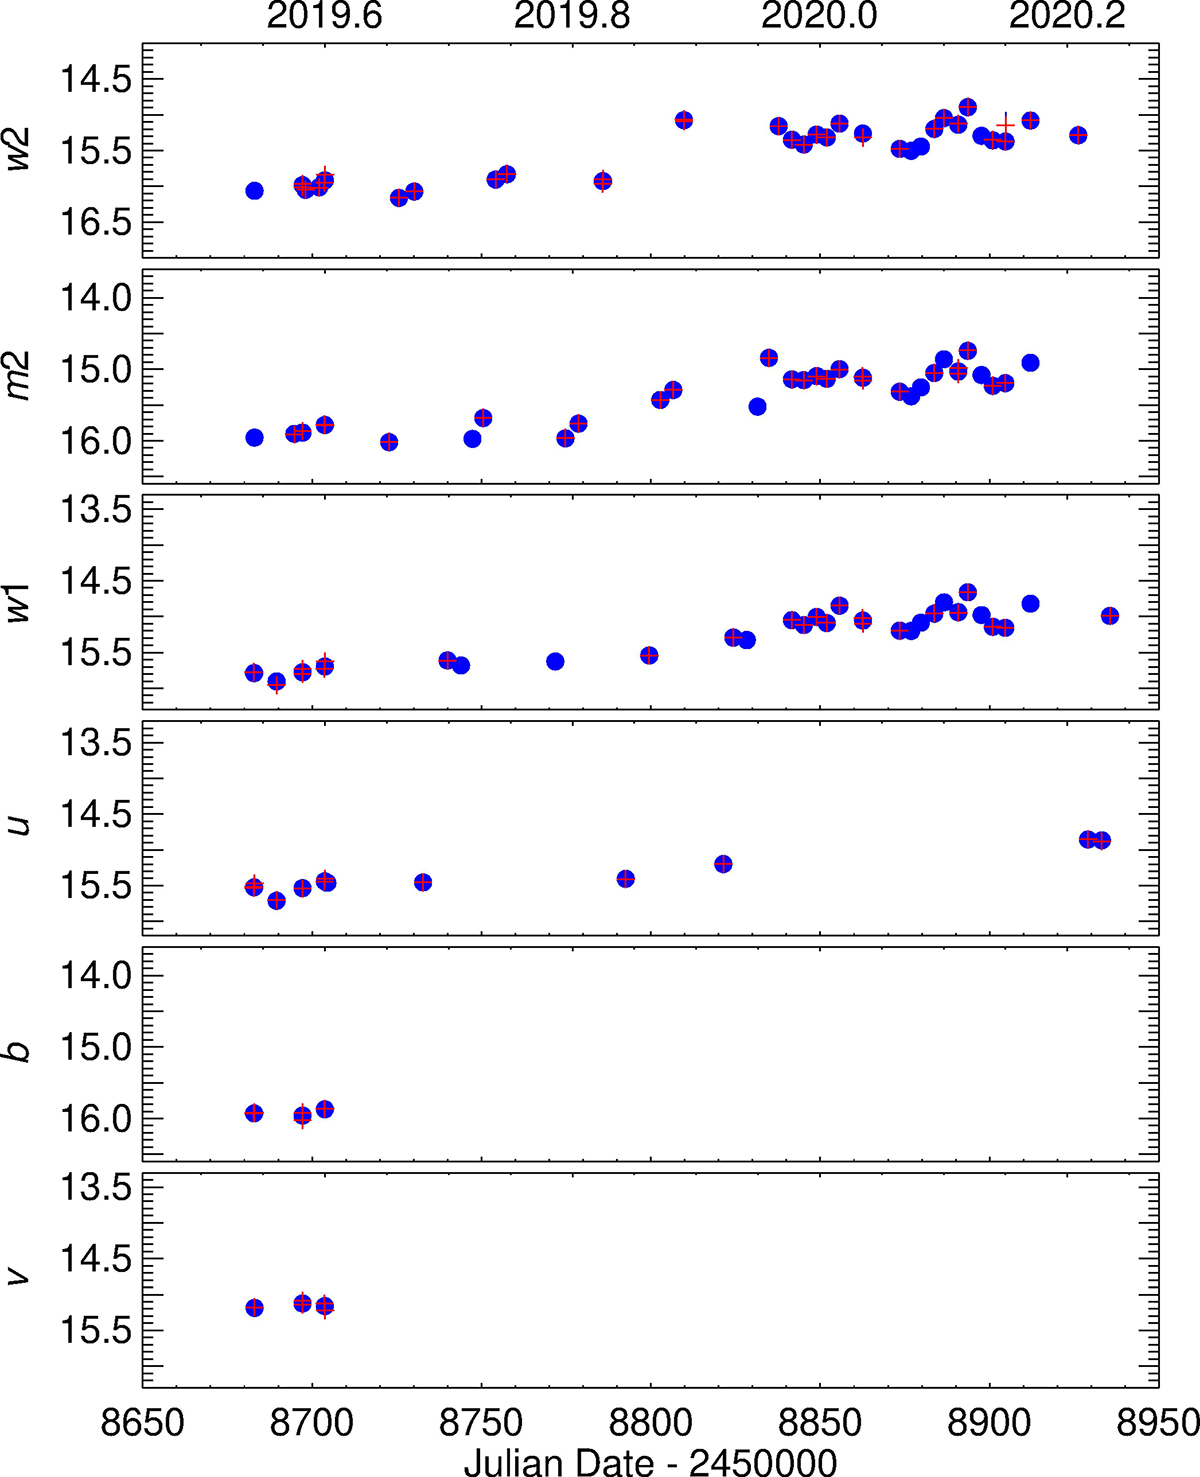
Swift-UVOT optical–UV light curves (observed magnitudes) in the period considered in this paper. Red plus symbols correspond to photometry on single exposures; blue dots correspond to the results of co-adding the exposures of the same observations.
Current usage metrics show cumulative count of Article Views (full-text article views including HTML views, PDF and ePub downloads, according to the available data) and Abstracts Views on Vision4Press platform.
Data correspond to usage on the plateform after 2015. The current usage metrics is available 48-96 hours after online publication and is updated daily on week days.
Initial download of the metrics may take a while.