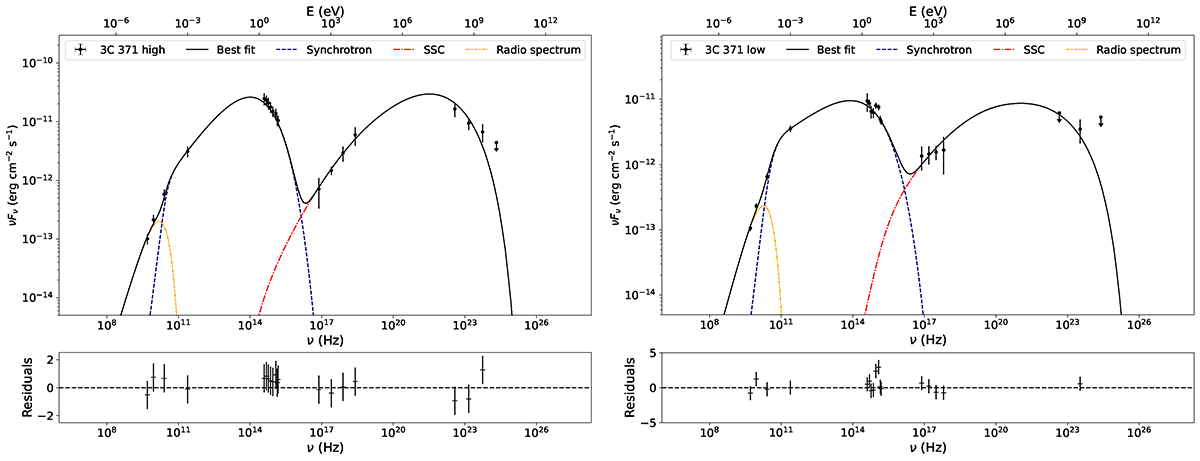
Fig. D.1.
Download original image
Broadband SED models for the high (left) and low (right) brightness states of 3C 371 considering only γ-ray emission produced through SSC scattering. The top panels contain the broadband SEDs, with the contribution of each component and the best fit model being represented with different markers, lines and colours as indicated in the legend. The bottom panels represent the residuals of the fitted models.
Current usage metrics show cumulative count of Article Views (full-text article views including HTML views, PDF and ePub downloads, according to the available data) and Abstracts Views on Vision4Press platform.
Data correspond to usage on the plateform after 2015. The current usage metrics is available 48-96 hours after online publication and is updated daily on week days.
Initial download of the metrics may take a while.