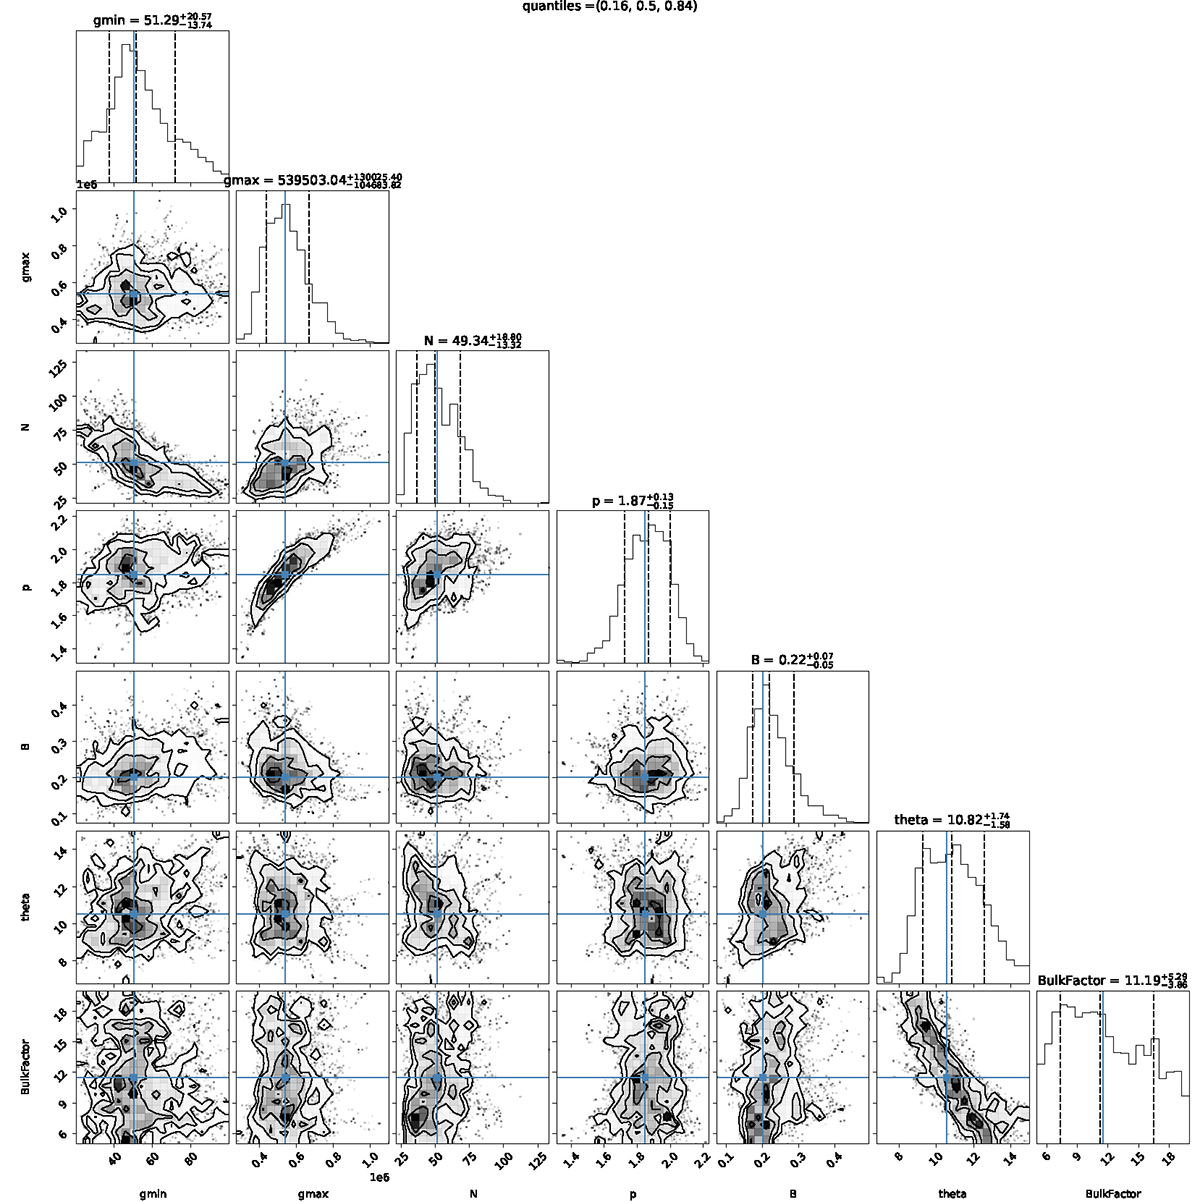
Fig. C.2.
Download original image
Corner plot summary of the parameter distributions estimated through the MCMC procedure for the high state SED model. The panels on the diagonal show the distribution of each parameter, indicating the best fit value and the derived uncertainties with the black solid and dashed lines, respectively. The best fit value of each parameter and its corresponding uncertainties are also indicated on top of each histogram. The panels below the diagonal show the 2-dimensional projections of the histograms for each pair of parameters.
Current usage metrics show cumulative count of Article Views (full-text article views including HTML views, PDF and ePub downloads, according to the available data) and Abstracts Views on Vision4Press platform.
Data correspond to usage on the plateform after 2015. The current usage metrics is available 48-96 hours after online publication and is updated daily on week days.
Initial download of the metrics may take a while.