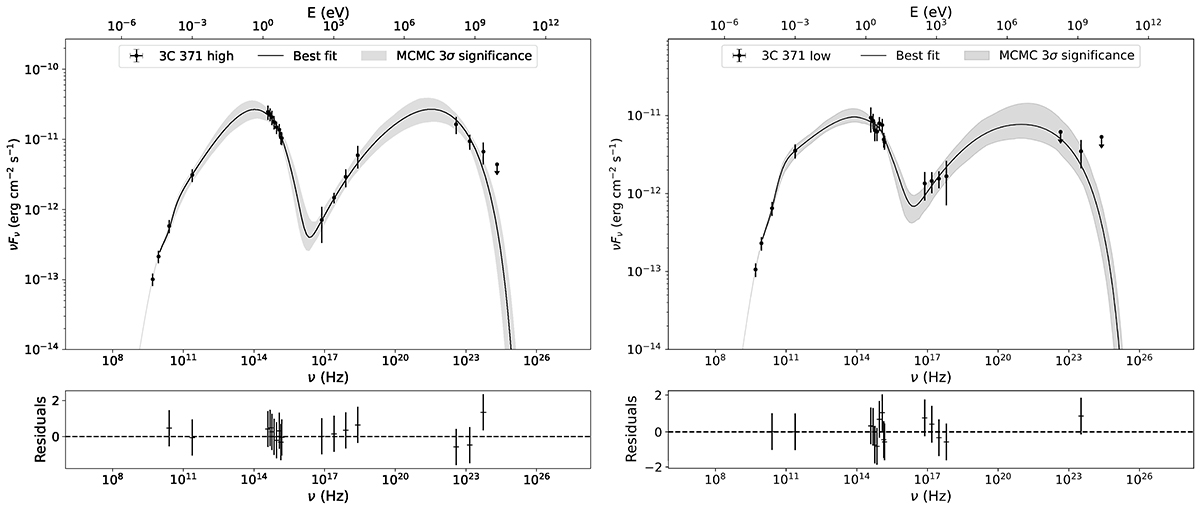
Fig. C.1.
Download original image
Broadband SED models of 3C 371. Left: High-state SED. Right: Low-state SED. The spectral points of each model are represented with the blue markers. Downward pointing arrows represent upper limits. The black solid line corresponds to the best fit and the grey contours represent the 3σ confidence region of the fit. The bottom panel of each SED shows the residuals of the model.
Current usage metrics show cumulative count of Article Views (full-text article views including HTML views, PDF and ePub downloads, according to the available data) and Abstracts Views on Vision4Press platform.
Data correspond to usage on the plateform after 2015. The current usage metrics is available 48-96 hours after online publication and is updated daily on week days.
Initial download of the metrics may take a while.