Fig. 4
Download original image
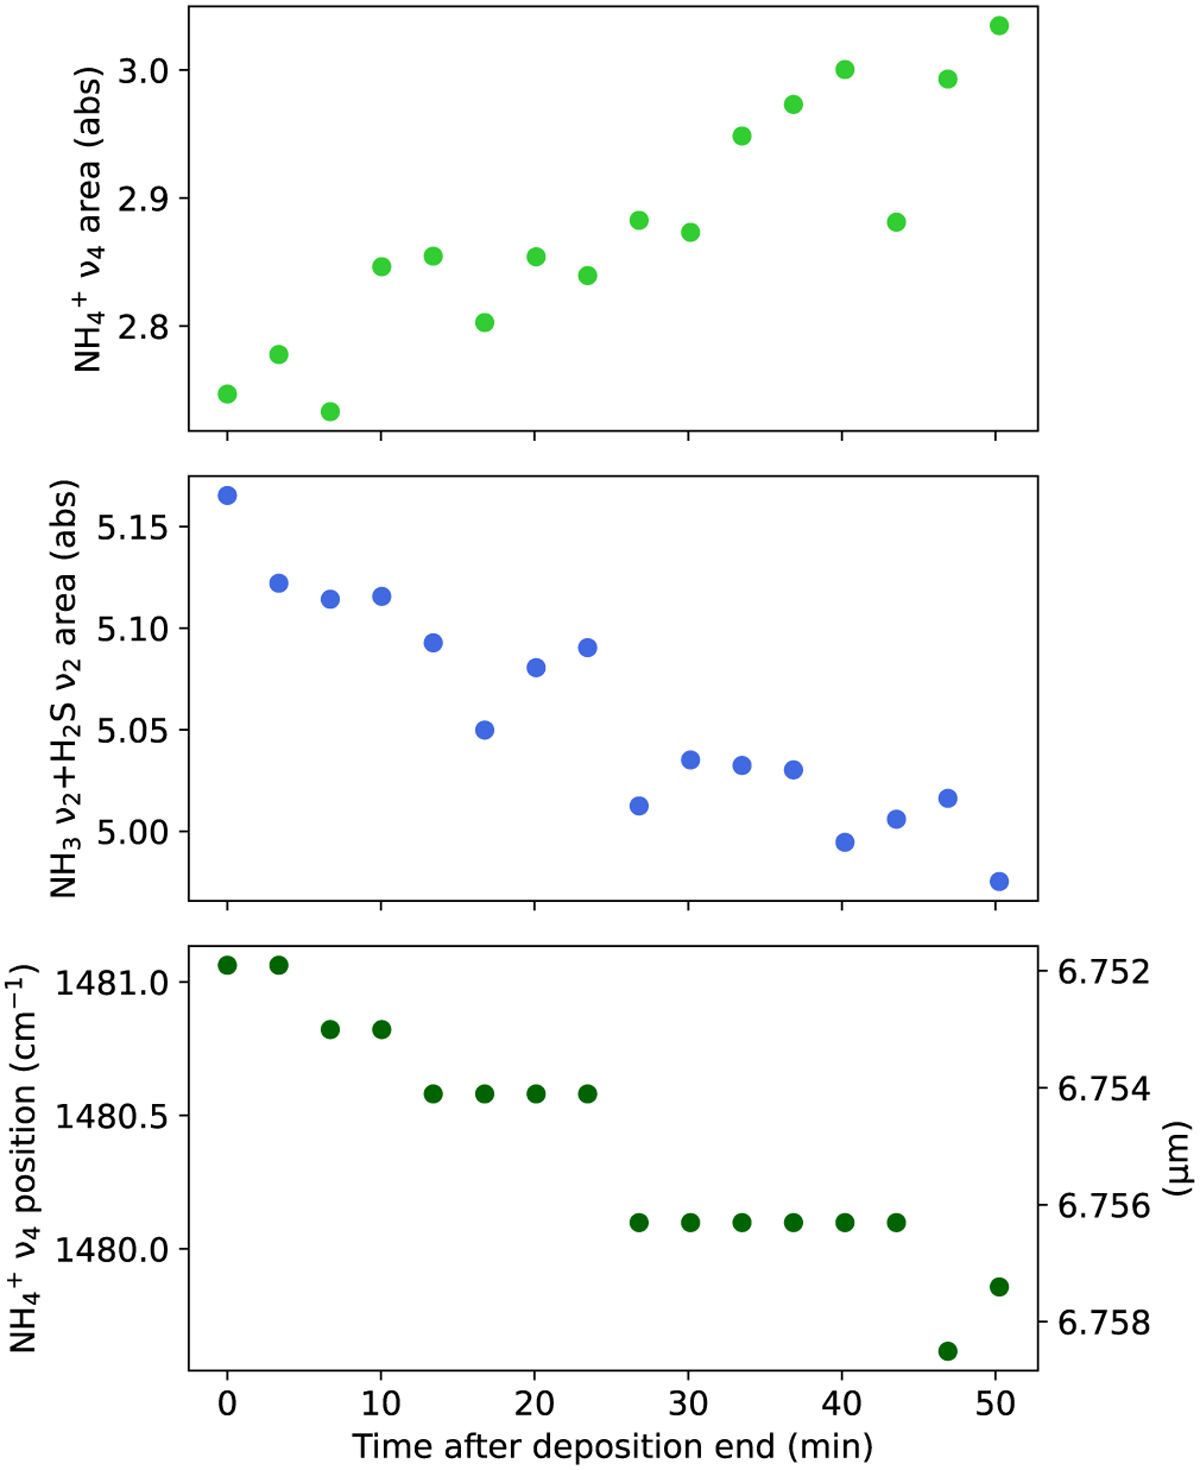
Characterization of selected features in the H2O:NH3:H2S 4:3:2 spectra in the period between the end of the ice deposition and the start of the ice warm-up. During this time, the sample was held at 15 K. Top: peak area of the NH4+ ν4 feature. Middle: peak area of the blended NH3 umbrella bending and H2S bending features. Bottom: peak position of the NH4+ ν4 feature.
Current usage metrics show cumulative count of Article Views (full-text article views including HTML views, PDF and ePub downloads, according to the available data) and Abstracts Views on Vision4Press platform.
Data correspond to usage on the plateform after 2015. The current usage metrics is available 48-96 hours after online publication and is updated daily on week days.
Initial download of the metrics may take a while.