Fig. 14
Download original image
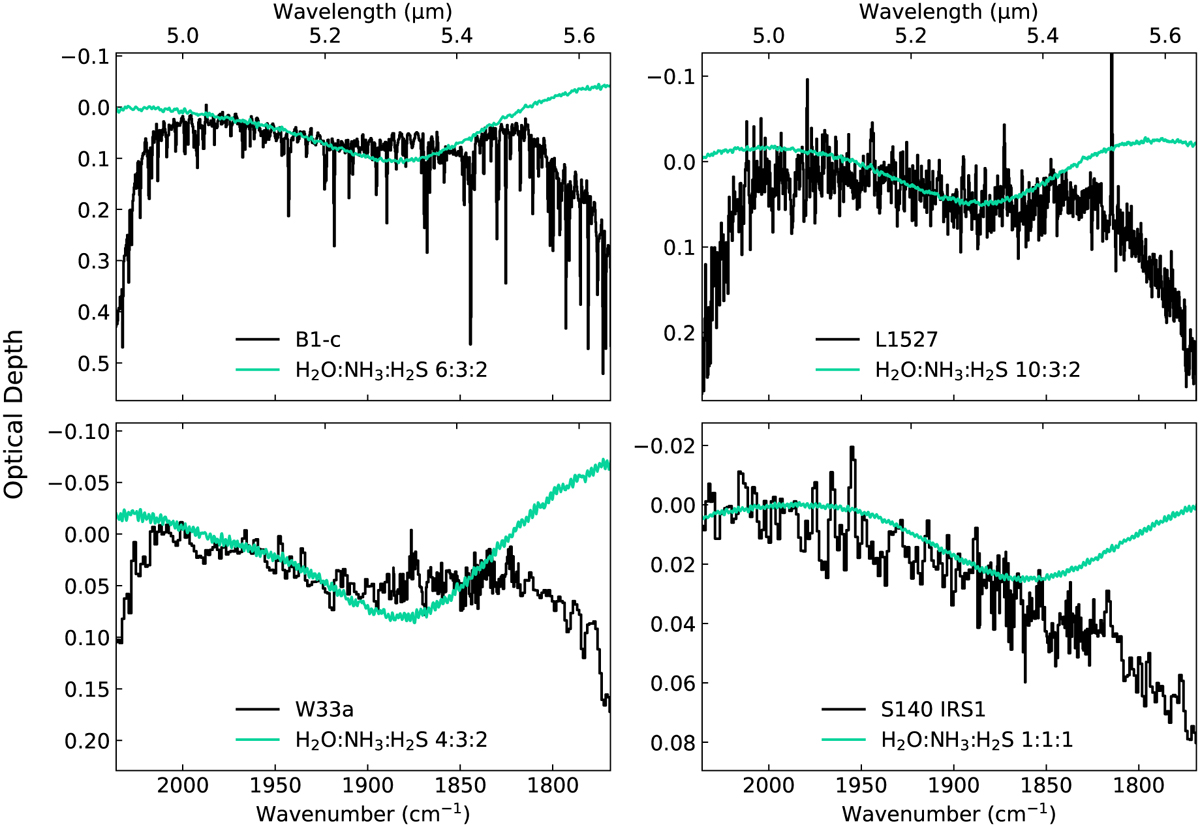
Laboratory NH4SH:H2O data scaled with the same factor as that used to fit the 6.85 µm band in Figure 9 plotted with the global continuum-subtracted spectra of four protostars, zoomed in on the 4.8–5.6 µm region where a weak and broad absorption is observed. The profile of the observed absorption matches well the NH4+ ν4 + SH− libration combination mode in the laboratory spectra. Plots of the global continua applied to the observed spectra can be found in Appendix E.1.
Current usage metrics show cumulative count of Article Views (full-text article views including HTML views, PDF and ePub downloads, according to the available data) and Abstracts Views on Vision4Press platform.
Data correspond to usage on the plateform after 2015. The current usage metrics is available 48-96 hours after online publication and is updated daily on week days.
Initial download of the metrics may take a while.