Fig. 13
Download original image
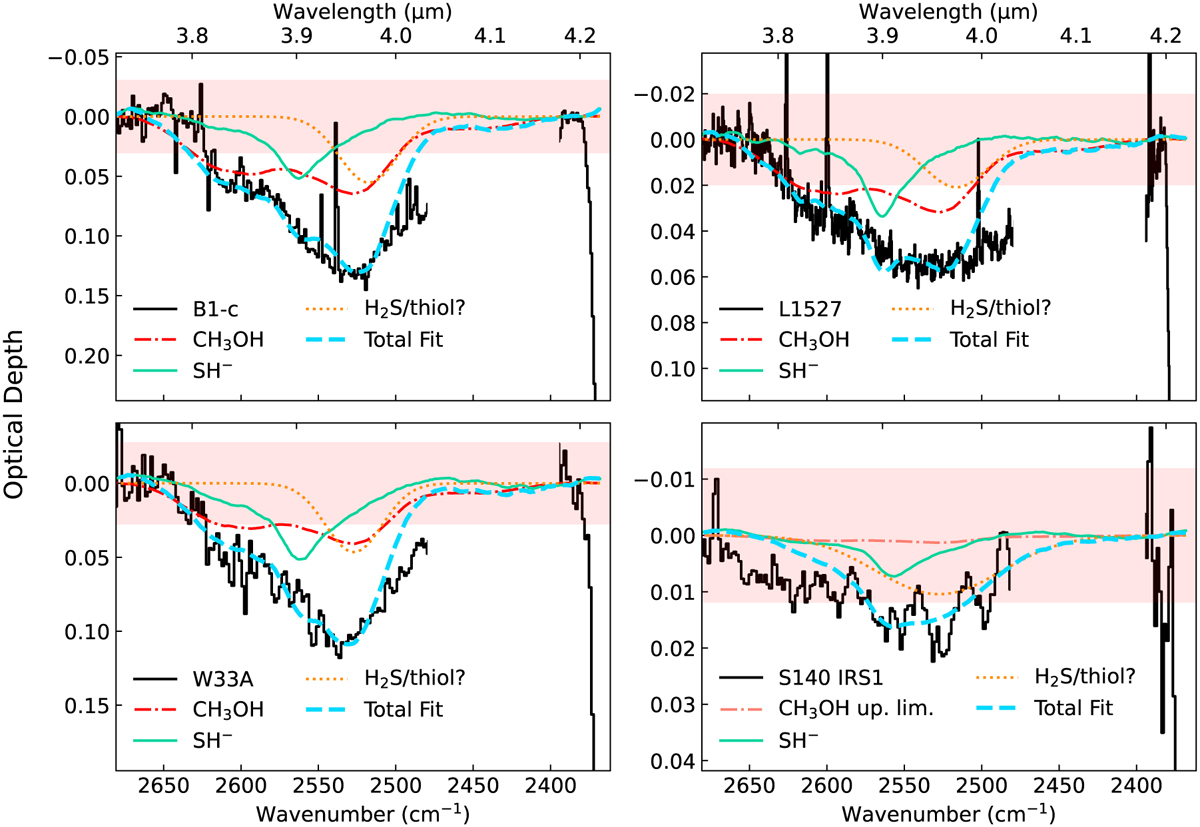
Fits of the SH− stretching mode from laboratory NH4SH:H2O spectra (dark green solid trace) and the combination modes from laboratory CH3OH spectra (dash-dotted red or pink trace) to the absorption complex between 3.8–4.2 µm observed toward four protostars. The fit SH− features are isolated from the laboratory spectra via a local continuum subtraction and scaled with the same factors as those used to fit the 6.85 µm bands in Figure 9. The CH3OH features are similarly scaled using literature CH3 OH ice column densities or upper limits calculated from the 3.53 or 9.74 µm features. As the SH− stretching mode and CH3OH combination modes are some of the weakest spectral features of the investigated ices, both the NH4SH and CH3OH laboratory spectra are smoothed with a Savgol filter prior to fitting to remove experimental noise. Excess absorptions that is not fit with SH− and CH3OH features are fit with Gaussians (dotted orange trace) that could be attributed to a combination of H2S and thiol ices. The full fit is indicated with a dashed light green trace, and the horizontal shaded red bars indicate 3σ levels calculated from RMS errors in the 3.72–3.77 µm range. Data from 4.03–4.18 µm (G395H gap in JWST data, low S/N region in ISO data) is excluded from the plot. Plots of the local continua applied to the observed spectra can be found in Appendix E.1.
Current usage metrics show cumulative count of Article Views (full-text article views including HTML views, PDF and ePub downloads, according to the available data) and Abstracts Views on Vision4Press platform.
Data correspond to usage on the plateform after 2015. The current usage metrics is available 48-96 hours after online publication and is updated daily on week days.
Initial download of the metrics may take a while.