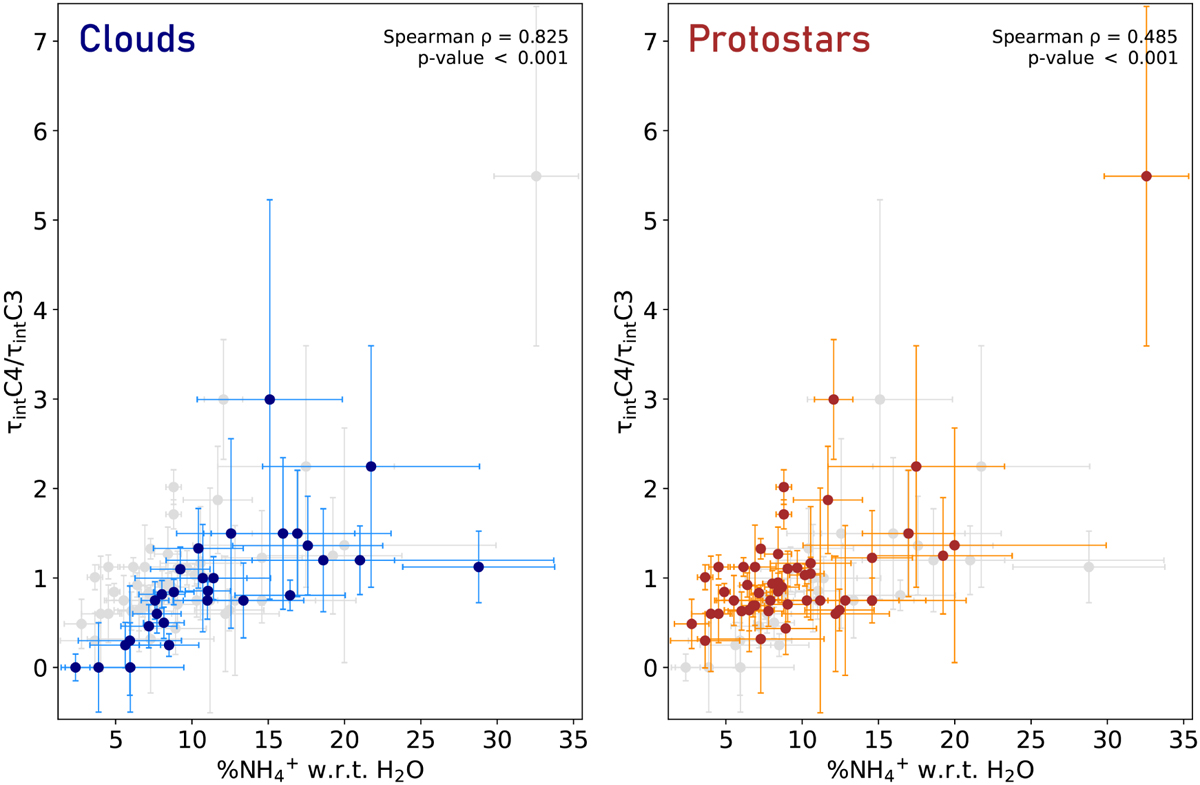
Fig. 11
Download original image
Abundances of the ammonium cation with respect to H2O ice plotted against the τintC4/τintC3 ratios of ices toward isolated dense clouds (left, blue) and protostars (right, red). To facilitate comparison, the protostellar and cloud values are also plotted in the left and right plots, respectively, in light gray. A higher τintC4/τintC3 is indicative of a greater redshift in the peak position of the 6.85 µm feature. The plotted values are taken from Boogert et al. (2011) (clouds) and Boogert et al. (2008) (protostars). The Spearman’s rank correlation coefficient ρ and the p-value indicating probability of noncorrelation are provided in the top right corner. The plotted NH4+ abundances have been multiplied by a correction factor of 4.4/3.6 to account for the difference between NH4+ ν4 mode band strength used by Boogert et al. (2008) and Boogert et al. (2011) (4.4× 10⁻¹⁷ cm molec−1 from Schutte & Khanna 2003) and the band strengths calculated in this work to enable a direct comparison to our NH4+ ice upper limits in Table 5. Upper limits have been excluded from this plot, as well as data from the sources 2MASS J19214480+1121203 (due to the high error of its τintC4/τintC3 ratio) and IRAS 03301+3111 (due to its τintC4/τintC3 ratio being undefined because its τintC3 = 0).
Current usage metrics show cumulative count of Article Views (full-text article views including HTML views, PDF and ePub downloads, according to the available data) and Abstracts Views on Vision4Press platform.
Data correspond to usage on the plateform after 2015. The current usage metrics is available 48-96 hours after online publication and is updated daily on week days.
Initial download of the metrics may take a while.